Bitcoin Price Struggles to Break $90,000: What’s Next?
Bitcoin price struggles to break $90,000 after a month-long battle. Discover why BTC faces resistance and what analysts predict for the market.
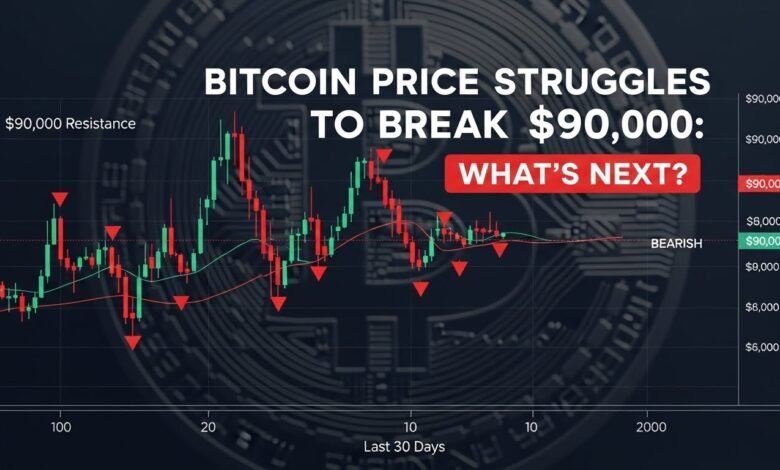
Bitcoin price struggled to break $90,000 over the past month. Despite multiple attempts to surge past this psychological barrier, the world’s leading digital asset continues to face significant resistance at this crucial price point. This prolonged battle has left investors and traders questioning whether Bitcoin can finally breach this threshold or if a deeper correction is imminent. The Bitcoin price struggles to break $90,000 narrative has dominated headlines throughout December, creating both anxiety and opportunity among market participants who are closely monitoring every price movement for signs of a definitive breakout or breakdown.
The current market dynamics reflect a complex interplay of technical resistance, profit-taking behavior, macroeconomic uncertainties, and shifting investor sentiment that collectively conspire to keep Bitcoin trapped below this significant milestone. Understanding the factors behind this resistance and analyzing potential scenarios can help investors navigate this critical juncture in the cryptocurrency market cycle.
$90,000 Resistance Level
The $90,000 price point has emerged as a formidable barrier for Bitcoin, functioning as both a psychological and technical resistance level that has repeatedly rejected upward price movements. This resistance isn’t arbitrary but rather represents a confluence of several market forces that create selling pressure precisely at this level.
From a technical analysis perspective, the $90,000 zone coincides with previous consolidation areas where significant trading volume accumulated during earlier price discovery phases. When Bitcoin approaches this level, traders who purchased at lower prices often choose to lock in profits, creating substantial selling pressure that overwhelms buying demand. Additionally, algorithmic trading systems and institutional desks have programmed sell orders clustered around round numbers like $90,000, amplifying the resistance effect.
The Bitcoin market resistance at this level also reflects broader market psychology. Round numbers naturally attract attention and become self-fulfilling prophecies in financial markets. Traders anticipate resistance at these levels, leading them to position accordingly, which paradoxically strengthens the resistance they anticipated. This phenomenon has kept BTC price action confined to a narrow range despite multiple bullish catalysts that would typically drive prices higher.
Market depth analysis reveals that the order books thin out considerably above $89,500, indicating that fewer buyers are willing to chase Bitcoin at these elevated prices. This liquidity gap makes it increasingly difficult for the asset to maintain momentum when approaching the $90,000 threshold, as relatively modest selling pressure can trigger sharp reversals that discourage further buying attempts.
Technical Analysis: What Chart Patterns Reveal
Examining the Bitcoin technical indicators provides crucial insights into why the Bitcoin price struggles to break $90,000 and what might happen next. The daily charts show Bitcoin has formed a consolidation pattern characterized by higher lows and consistent rejections at the $90,000 level, creating what technical analysts call an ascending triangle formation.
The Relative Strength Index has oscillated between 55 and 70 during this consolidation phase, suggesting that Bitcoin maintains bullish momentum but lacks the explosive strength needed to overcome significant resistance. Each time the RSI approaches 70, signaling overbought conditions, selling pressure intensifies and pushes prices back down. This pattern indicates that while bulls maintain control of the broader trend, they haven’t mustered sufficient force for a decisive breakout.
Moving average analysis shows Bitcoin trading above both the 50-day and 200-day moving averages, confirming the underlying bullish trend remains intact despite the recent consolidation. However, the 50-day moving average has begun flattening, suggesting weakening upward momentum. If this indicator starts declining and crosses below the 200-day moving average, it could signal a shift toward bearish sentiment.
Volume patterns during this consolidation period reveal declining interest in pushing prices higher. Each successive attempt to break $90,000 has come with progressively lower volume, indicating waning conviction among buyers. Conversely, volume spikes during price rejections suggest active selling by entities eager to capitalize on these temporary rallies. This volume divergence represents a warning sign that the current consolidation might resolve with a downward correction rather than the anticipated breakout.
The Bollinger Bands have contracted significantly during this month-long battle, indicating decreasing volatility and suggesting that a major price movement is imminent. Historically, periods of low digital asset volatility precede explosive moves in either direction, making the current setup particularly significant for traders positioning themselves for the next major trend.
Macroeconomic Factors Influencing Bitcoin’s Price Action
The broader macroeconomic environment plays a pivotal role in determining whether Bitcoin price struggles to break $90,000 will continue or resolve favorably. Central bank policies, particularly those of the Federal Reserve, have profound implications for risk assets like cryptocurrency. Recent signals from monetary authorities regarding interest rate trajectories have created uncertainty that dampens enthusiasm for speculative assets.
The strengthening US dollar has exerted downward pressure on Bitcoin and other cryptocurrencies throughout this consolidation period. As the dollar appreciates against major currencies, it typically draws capital away from alternative stores of value, reducing the flow of fresh investment into the crypto market. The Dollar Index maintaining elevated levels above 107 has coincided directly with Bitcoin’s inability to sustain rallies above $89,000.
Traditional financial markets have also influenced cryptocurrency trading patterns during this period. Stock market volatility, particularly in technology sectors that correlate closely with crypto assets, has created risk-off sentiment that permeates across asset classes. When equities face selling pressure, institutional investors typically reduce exposure to higher-risk assets like Bitcoin, limiting upside potential even when technical setups appear favorable.
Inflation data and employment figures continue shaping expectations about monetary policy, which in turn affects Bitcoin’s appeal as an inflation hedge. Recent reports showing persistent inflationary pressures might eventually favor Bitcoin as investors seek alternatives to depreciating fiat currencies, but in the near term, they support hawkish central bank policies that create headwinds for all risk assets.
Institutional Activity and Market Sentiment
Institutional participation in cryptocurrency markets has grown substantially, making their behavior crucial for understanding why the Bitcoin price struggles to break $90,000. Analysis of exchange flows and on-chain metrics reveals that large holders have adopted a cautious stance during this consolidation phase, neither accumulating aggressively nor distributing significantly.
Exchange-traded fund flows provide valuable insights into institutional sentiment. While Bitcoin ETFs have seen periodic inflows, they haven’t matched the enthusiasm observed during earlier rally phases when Bitcoin surged from $60,000 to $85,000. This moderation in institutional demand suggests that professional investors see limited upside potential at current price levels or are waiting for clearer catalysts before committing additional capital.
The crypto market sentiment index, which aggregates various metrics including social media activity, search trends, and trading volumes, has declined from extreme greed to neutral territory during this consolidation. This shift indicates that retail enthusiasm has cooled considerably, removing a source of buying pressure that previously helped propel Bitcoin through resistance levels.
Whale activity tracked through on-chain analytics shows these large holders distributing small amounts during rallies toward $90,000 while accumulating during pullbacks to $85,000. This behavior suggests sophisticated investors are range-trading rather than positioning for an imminent breakout, which helps explain the persistent resistance at higher levels.
Derivatives markets offer additional perspective on institutional positioning. Funding rates in perpetual futures contracts have declined from elevated positive levels to neutral, indicating that leveraged long positions have been unwound. Open interest has remained relatively stable, suggesting that while traders maintain exposure, they’re not adding aggressively to positions. Options markets show increased hedging activity with elevated put volume relative to calls, reflecting concerns about potential downside risks.
Historical Context: Previous Resistance Battles
Examining Bitcoin’s historical price action when facing similar resistance battles provides context for the current situation where Bitcoin price struggles to break $90,000. Throughout its history, Bitcoin has encountered multiple instances where it consolidated below significant psychological levels before eventually breaking through.
The $20,000 resistance in 2017 provides an instructive parallel. Bitcoin repeatedly tested this level throughout November and early December before finally breaking through in mid-December, only to peak shortly afterward and enter a prolonged bear market. This pattern serves as both inspiration for bulls hoping for a breakout and caution for those worried about buying at local tops.
More recently, the $60,000 level presented similar challenges in early 2021. Bitcoin consolidated below this resistance for several weeks before breaking through and reaching its then-all-time high above $64,000. However, this breakout was followed by a sharp correction that saw prices decline more than 50 percent in subsequent months. These historical precedents suggest that while breakouts do occur, they don’t guarantee sustained rallies and can sometimes precede major reversals.
The duration of consolidation periods also offers insights. Bitcoin typically consolidates between three to six weeks before resolving major resistance levels. The current Bitcoin resistance levels battle approaching the one-month mark places it within the typical timeframe, suggesting a resolution may be approaching. Whether this resolution breaks upward or downward remains the critical question occupying traders’ attention.
Statistical analysis of previous consolidation patterns shows that breakouts accompanied by volume expansion and sustained momentum tend to lead to successful trend continuations, while low-volume breakouts frequently fail and reverse. Applying these lessons to the current situation suggests that any breakout above $90,000 would require substantial volume confirmation to have a high probability of success.
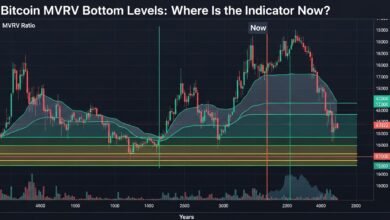
On-Chain Metrics and Blockchain Fundamentals
The realized price, which represents the average price at which all Bitcoin last moved on-chain, currently sits around $60,000. This metric indicates that the average Bitcoin holder maintains substantial unrealized profits, which can create selling pressure as these holders seek to lock in gains. The significant gap between current prices and realized price suggests the market has room for correction before reaching levels where most holders break even and selling pressure typically diminishes.
Network activity metrics show modest growth in active addresses and transaction counts during this consolidation phase. While these figures remain healthy and indicate continued network usage, they haven’t accelerated in ways that typically accompany major bull runs. This moderate growth pattern suggests steady but unspectacular demand for Bitcoin transactions, which aligns with the sideways price action observed in recent weeks.
The supply of Bitcoin held on exchanges continues declining gradually, indicating that holders prefer self-custody over keeping assets on trading platforms. This trend generally indicates bullish long-term sentiment, as it suggests holders aren’t positioning to sell. However, the pace of exchange outflows has slowed compared to earlier periods, suggesting less aggressive accumulation by long-term holders at current price levels.
Mining metrics reveal healthy fundamentals with hash rate maintaining near all-time highs. This demonstrates that miners remain committed to securing the network despite volatile prices. However, miner outflows to exchanges have increased slightly during rallies toward $90,000, suggesting some mining operations are taking profits at these levels rather than holding for higher prices.
The Spent Output Profit Ratio, which measures the degree of profit-taking occurring on-chain, has elevated during rallies but remains below levels typically associated with local tops. This suggests moderate profit-taking rather than excessive euphoria, which could actually be constructive for supporting a sustained breakout once resistance is overcome.
Competing Narratives: Bull vs. Bear Cases
Bulls argue that the consolidation below $90,000 represents healthy price action following a substantial rally from lower levels. They point to strong fundamentals including institutional adoption, regulatory clarity in major jurisdictions, and Bitcoin’s established role as digital gold. From this perspective, the current consolidation builds a strong foundation for the next leg higher, with each test of $90,000 weakening resistance as sellers exhaust their supply. Bulls anticipate that once this resistance breaks, Bitcoin will rapidly advance toward $100,000 and beyond, driven by FOMO among sidelined investors and momentum traders.
The bullish case also emphasizes that Bitcoin has maintained support above the $84,000 level, forming higher lows that indicate accumulation by strategic buyers. They argue that institutional players are deliberately accumulating during this consolidation without pushing prices aggressively higher, preferring to build positions at favorable prices before the inevitable breakout. Additionally, bulls note that many macroeconomic factors that drove Bitcoin’s rise remain intact, including concerns about fiat currency debasement and geopolitical uncertainties that favor decentralized assets.
Bears counter that the inability to break $90,000 despite multiple attempts signals exhausted buying pressure and impending correction. They highlight declining volume, weakening momentum indicators, and the historical tendency for assets to correct after parabolic rallies. From this perspective, the consolidation represents distribution by smart money to retail investors before a significant pullback that could test support levels around $75,000 or lower.
The bearish interpretation also emphasizes macroeconomic headwinds, including persistent inflation, hawkish central banks, and potential recession risks that typically pressure risk assets. Bears argue that Bitcoin’s correlation with technology stocks makes it vulnerable to broader market corrections, and that current valuations already reflect optimistic scenarios. They point to similar consolidation patterns that preceded major corrections in 2017 and 2021, suggesting history may repeat with another boom-bust cycle.
Potential Catalysts That Could Break the Stalemate
Positive catalysts include unexpected dovish signals from major central banks regarding monetary policy. If the Federal Reserve or other central banks signal rate cuts sooner than expected, it could weaken the dollar and drive capital toward alternative assets like Bitcoin. Similarly, worse-than-expected inflation data paradoxically might boost Bitcoin by reinforcing its narrative as an inflation hedge, despite the negative implications for risk assets generally.
Institutional announcements could provide significant positive catalysts. Major corporations adding Bitcoin to their balance sheets, traditional financial institutions launching new cryptocurrency products, or sovereign wealth funds disclosing Bitcoin allocations would validate the asset class and potentially trigger FOMO among institutional peers. Such announcements have historically preceded substantial Bitcoin rallies as they signal mainstream acceptance.
Regulatory developments represent wildcard catalysts that could swing either direction. Positive regulatory clarity in major markets like the United States or European Union could remove uncertainty and unlock institutional capital currently sitting on sidelines. Conversely, unexpected regulatory crackdowns or restrictive policies could trigger selling pressure and extend the consolidation or precipitate corrections.
Technical catalysts include a decisive break above $90,000 accompanied by strong volume. Such a breakout would trigger stop-loss orders from short sellers and take-profit levels from those betting on resistance holding, potentially creating a cascade of buying that rapidly pushes prices higher. The psychological impact of Bitcoin reaching new all-time highs often triggers momentum-driven rallies that carry prices well beyond initial breakout levels.
Negative catalysts that could resolve the consolidation downward include broader market corrections in equities, unexpected geopolitical crises, or major cryptocurrency-specific events like exchange failures or protocol vulnerabilities. Additionally, if Bitcoin tests $90,000 multiple more times without breaking through, traders may lose patience and liquidate positions, creating downward momentum that tests lower support levels.
Trading Strategies for the Current Environment
Breakout traders position themselves for the eventual resolution of consolidation by setting buy orders above $90,000 with the intention of riding momentum if resistance finally breaks. This approach requires patience to wait for confirmation and discipline to avoid false breakouts that reverse quickly. Proper breakout trading also involves scaling into positions rather than committing full capital immediately, protecting against whipsaws that characterize failed breakouts.
Long-term investors might view the current consolidation as an opportunity to accumulate positions through dollar-cost averaging, systematically purchasing Bitcoin regardless of short-term price fluctuations. This strategy removes the burden of timing the market perfectly and ensures participation if prices eventually move higher. However, it requires strong conviction and tolerance for potential drawdowns if consolidation resolves downward before eventually recovering.
Options strategies offer sophisticated approaches for the current environment. Selling covered calls against Bitcoin holdings generates premium income during consolidation while capping upside if prices break out. Buying straddles or strangles positions traders for profit regardless of breakout direction, though these strategies can lose value if consolidation continues longer than anticipated. Iron condors profit from ongoing range-bound trading but expose traders to losses if prices move sharply in either direction.
Risk management remains paramount regardless of chosen strategy. Position sizing should reflect individual risk tolerance and account for Bitcoin’s inherent volatility. Stop-loss orders protect against adverse moves, though traders must account for Bitcoin’s tendency toward sharp wicks that trigger stops before reversing. Diversification across multiple assets and strategies reduces exposure to any single outcome.
What Analysts and Experts Are Saying
Market analysts and cryptocurrency experts offer varied perspectives on the current situation where Bitcoin price struggles to break $90,000, reflecting the genuine uncertainty surrounding near-term price direction. Examining these professional opinions provides additional context for individual decision-making.
On-chain analysts focus on blockchain metrics that suggest the network fundamentals remain healthy despite price stagnation. They point to stable or increasing metrics around active addresses, transaction volumes adjusted for economic value, and continued reduction in exchange balances as positive signs. However, some on-chain analysts note that the degree of realized profit remains elevated, suggesting continued selling pressure from holders who purchased at lower levels.
Macro-focused analysts emphasize the importance of traditional financial market conditions for Bitcoin’s near-term trajectory. They note that correlations between Bitcoin and technology stocks remain elevated, suggesting that cryptocurrency cannot entirely decouple from broader market trends. These analysts generally recommend monitoring Federal Reserve policy signals, dollar strength, and equity market stability as leading indicators for Bitcoin’s direction.
Institutional analysts from traditional finance backgrounds tend toward caution, noting that Bitcoin’s current valuation already reflects substantial optimism and that risk-reward ratios favor waiting for clearer signals before committing significant capital. They emphasize that while long-term Bitcoin fundamentals may remain intact, near-term price action depends heavily on momentum and sentiment that can shift rapidly.
Independent cryptocurrency researchers offer the most bullish perspectives generally, emphasizing Bitcoin’s unique properties as a decentralized, scarce asset with growing institutional acceptance. They argue that short-term price fluctuations represent noise against the backdrop of Bitcoin’s long-term adoption trajectory and that current levels offer attractive entry points for multi-year time horizons.
Preparing for Multiple Scenarios
Prudent investors prepare for various outcomes rather than betting exclusively on a single scenario materializing when the Bitcoin price struggles to break $90,000. Developing contingency plans for different market resolutions enables more confident decision-making when events unfold.
The continued consolidation scenario sees Bitcoin remaining range-bound between $84,000 and $90,000 for an extended period, potentially several more weeks. This outcome favors range-trading strategies and requires patience from trend-following investors. Preparing for extended consolidation means conserving capital rather than forcing trades, accepting that the opportunity cost of waiting exceeds the risks of premature positioning. It also involves maintaining exposure to capture eventual resolution while avoiding overleveraging that creates pressure to close positions prematurely.
The bearish breakdown scenario involves Bitcoin losing support around $84,000 and correcting toward lower levels, potentially testing $75,000 or the $70,000 support zone. Preparing for this outcome means having stop-loss orders in place to limit downside, keeping reserve capital to potentially buy at lower levels, and maintaining emotional discipline to avoid panic-selling at worst prices. It also means recognizing that corrections represent normal market behavior rather than invalidation of long-term investment theses.
The violent whipsaw scenario sees Bitcoin breaking in one direction only to quickly reverse, potentially stopping out traders on both sides before ultimately resolving. Preparing for this possibility requires wider stop-loss placement or avoiding stop-loss orders entirely in favor of mental stops, along with position sizing that tolerates drawdowns without forced liquidation. It demands patience to let positions work and to avoid the temptation to constantly adjust based on short-term noise.
Conclusion
The ongoing situation where Bitcoin price struggles to break $90,000 represents a critical juncture that will significantly influence the cryptocurrency’s trajectory in the coming months. This month-long consolidation has tested the patience of bulls hoping for an immediate breakout while providing bears with ammunition to question Bitcoin’s momentum. Understanding the technical, fundamental, and psychological factors creating this resistance enables more informed decision-making.
The Bitcoin market resistance at $90,000 reflects a complex interplay of profit-taking, technical barriers, macroeconomic uncertainties, and shifting sentiment that collectively cap upside attempts. While historical patterns suggest these consolidations typically resolve eventually, the direction of resolution remains genuinely uncertain and depends on catalysts that haven’t yet materialized.
Investors should recognize that both breakout and breakdown scenarios remain viable, requiring preparation for multiple outcomes rather than exclusive commitment to a single view. The healthiest approach involves measured positioning that participates in potential upside while protecting against downside, combined with the discipline to adjust as market conditions evolve.
Whether you’re actively trading the current range, accumulating for long-term investment, or waiting on the sidelines for clearer signals, the key lies in matching strategies to personal circumstances and risk tolerance. The market will eventually resolve this consolidation, and those who’ve prepared thoughtfully across scenarios will navigate the outcome most successfully.
Are you positioned effectively for Bitcoin’s next major move? Consider reviewing your portfolio allocation, risk management approaches, and strategic plans to ensure they align with the current market environment, where Bitcoin price struggles to break $90,000 but eventually must resolve in one direction or another.
See more; Bitcoin Sinks Below $87,000: Crypto Slides as Metals Soar Post-Xmas