
Bitcoin MVRV Bottom Levels: Where Is the Indicator Now?
Discover where Bitcoin historically bottoms using MVRV levels, what the indicator shows today, and what it means for the next BTC price cycle.
Every seasoned Bitcoin investor knows that timing the market is nearly impossible—but certain on-chain metrics get remarkably close to flagging the real bottom. Among all the tools available to analysts today, the Bitcoin MVRV bottom levels have earned a reputation as one of the most reliable cycle indicators in all of crypto. MVRV, which stands for Market Value to Realized Value, compares the current market capitalization of Bitcoin against the aggregate cost basis of every coin on the network. When this ratio dips into historically significant zones, it has consistently marked periods of deep undervaluation—and powerful rebounds. Understanding where these levels sit, and where the indicator stands right now, could be the edge that separates reactive investors from strategic ones.
This article breaks down the mechanics behind the MVRV ratio, explores the specific bands where Bitcoin has historically found its cycle floor, examines the current reading, and explains what it could mean for the months ahead.
What Is the MVRV Ratio and Why Does It Matter?
Before diving into specific levels, it is essential to understand what the MVRV ratio actually measures. The metric was pioneered by on-chain analyst Murad Mahmudov and David Puell in 2018 and has since become a cornerstone of Bitcoin on-chain analysis. At its core, MVRV divides Bitcoin’s total market capitalization—what the entire supply is worth at the current market price—by its realized capitalization, which values each coin at the price it last moved on-chain.
The realized cap acts as a proxy for the aggregate cost basis of the entire Bitcoin holder base. When market cap is significantly higher than realized cap, the MVRV ratio rises well above 1, signaling that the average holder is sitting on large unrealized profits. Historically, readings above 3.5 to 4.0 have flagged market tops. Conversely, when the ratio falls below 1, the average Bitcoin holder is underwater—and that precise condition has repeatedly coincided with the most attractive buying opportunities in Bitcoin’s price history.
MVRV vs. MVRV Z-Score: Understanding the Difference
Many analysts also refer to the MVRV Z-Score, which is a normalized version of the raw ratio. The Z-Score subtracts the realized cap from the market cap and divides by the standard deviation of the market cap. This smooths out the data and makes cycle comparisons more statistically rigorous. Both versions tell a similar story—but the raw MVRV ratio is often easier to interpret for quick cycle-positioning decisions, which is why it remains the more widely cited of the two in mainstream crypto analysis.
Bitcoin Historically Bottoms Between These MVRV Levels
Data going back to Bitcoin’s earliest tradable years reveals a consistent pattern: the Bitcoin MVRV bottom levels cluster in a narrow and identifiable range. Specifically, every major Bitcoin cycle bottom on record has occurred when the MVRV ratio was trading somewhere between 0.5 and 1.0. This range has held across the 2011–2012 bear market, the extended 2014–2015 downturn, the vicious 2018–2019 correction, and the 2022 capitulation that followed the collapse of the Terra/LUNA ecosystem and the FTX implosion.
The 2015 bottom saw the MVRV ratio briefly touch as low as 0.57, one of the most extreme undervaluation readings in the asset’s history. The 2018 bottom registered a reading of approximately 0.69. The 2022 cycle low, which corresponded with Bitcoin trading near $15,500 in November of that year, saw the ratio drop to around 0.71. In each case, these readings below 1.0 acted as a flashing signal that the market had overshot to the downside and a mean reversion was not just likely but historically imminent.
Why the Sub-1.0 Zone Is Statistically Significant
A reading below 1.0 on the Bitcoin MVRV ratio means that the market is pricing Bitcoin below the aggregate cost basis of all holders. In other words, the average participant who has moved coins on-chain is sitting at a loss. This creates a situation where realized losses are widespread, sentiment is at its worst, and weak hands have already been flushed out of the market. Historically, this environment has not persisted for long. Bitcoin has never spent an extended period below an MVRV of 1.0 without staging a significant recovery, which is precisely why sophisticated investors treat this zone as a high-conviction accumulation window.
The 0.5–0.8 Accumulation Band Explained
Within the broader sub-1.0 zone, the 0.5 to 0.8 MVRV band has historically been the deepest and most rewarding area for long-term accumulation. Every time Bitcoin’s MVRV has fallen into this territory, forward returns measured over a 12 to 24 month horizon have been exceptional. This is not a coincidence—it reflects the mechanics of the Bitcoin realized price and the natural capitulation dynamics that occur when long-term holders absorb coins from panic sellers at steep discounts to the aggregate cost basis of the network.
Where Are Bitcoin MVRV Levels Right Now?
As of early 2026, Bitcoin’s MVRV ratio has been recovering from the lows established during the 2022 bear market and is currently trading in a zone that reflects the mid-cycle expansion phase. After spending months in the coveted sub-1.0 accumulation zone through late 2022 and into early 2023, the ratio broke decisively back above 1.0 as Bitcoin’s price began its recovery, ultimately surpassing previous all-time highs during the 2024–2025 bull cycle.
With Bitcoin pushing into new price discovery territory, the current MVRV ratio reading reflects a market where the average holder is once again sitting on meaningful unrealized profits. This is expected behavior for a maturing bull market. However, it also means that the metric is no longer in the historically attractive Bitcoin MVRV bottom levels that defined the 2022 lows. Investors who are watching this indicator closely understand that the time to accumulate aggressively based on MVRV signals has passed—at least for this cycle’s primary bottom.
Reading the Transition From Bottom to Expansion
The transition of MVRV from the sub-1.0 zone back through 1.0 and toward 2.0 is historically one of the most confirming signals of a new bull cycle. When Bitcoin’s on-chain bottom indicator breaks back above 1.0 on a sustained basis, it means the realized cap has begun growing more slowly than the market cap—a reflection of rising prices outpacing the cost basis of newer entrants. This inflection point has preceded some of Bitcoin’s most explosive price runs, including the 2019 recovery rally and the historic 2020–2021 bull market that took BTC from under $10,000 to over $68,000.
What MVRV Levels Flag a Market Top?
While this article focuses on Bitcoin MVRV bottom levels, it would be incomplete without acknowledging the other end of the spectrum. Historical cycle tops have occurred when the MVRV ratio reached or exceeded 3.5 to 4.0, with the most euphoric tops seeing readings near or above 7.0 in Bitcoin’s earlier years when the market was smaller and more volatile. As Bitcoin matures and capital inflows grow, these extreme readings have become less pronounced—but the directional signal remains valid. A rising MVRV above 3.0 warrants increasing caution, just as a falling MVRV below 1.0 warrants increasing conviction.
How to Use Bitcoin MVRV Bottom Levels in Your Investment Strategy
Understanding the MVRV ratio Bitcoin history is one thing; translating it into actionable strategy is another. The most effective way to use this metric is not as a precise timing tool but as a framework for cycle positioning. When MVRV is below 1.0, the data strongly supports a dollar-cost averaging strategy with above-average conviction. When it is between 1.0 and 2.5, the market is in a broadly constructive phase, but individual position sizing should reflect the risk of a mid-cycle correction. Above 3.0, the historical record suggests reducing exposure incrementally, regardless of prevailing bullish sentiment.
It is also worth noting that MVRV should never be used in isolation. Pairing it with other Bitcoin on-chain metrics such as the Puell Multiple, the Stock-to-Flow deviation bands, the Spent Output Profit Ratio (SOPR), and the Long-Term Holder Supply in Profit creates a much more robust analytical framework. When multiple on-chain indicators align—especially when several simultaneously signal deep undervaluation—the historical probability of a sustained recovery becomes significantly higher.
Limitations of MVRV as a Standalone Indicator
No on-chain metric is infallible, and the Bitcoin MVRV ratio is no exception. One important limitation is that it does not account for coins that are permanently lost—wallets whose private keys no longer exist. If a significant portion of Bitcoin’s supply has been permanently removed from circulation, the realized cap may be somewhat inflated, which could cause the ratio to understate the true degree of market undervaluation. Analysts have proposed adjusted versions of the metric that attempt to account for lost coins, but none has achieved universal adoption.
Additionally, MVRV is a lagging indicator by nature. It reflects what has already happened with market and realized caps, not what is about to happen. During rapidly moving markets—either sharp crashes or explosive rallies—the metric may not update its signal quickly enough to serve as a real-time guide. For that reason, it is best used as a strategic overlay rather than a tactical trading signal.
Historical Performance of Bitcoin During MVRV Bottom Signals
The track record of Bitcoin MVRV bottom levels as a forward return predictor is compelling. Looking at every instance where the ratio fell below 1.0 and subsequently recovered, the median 12-month forward return has been well above 200%. The 2015 bottom signal, triggered when MVRV touched 0.57, preceded a roughly 800% gain over the following 18 months. The 2018–2019 signal, with the ratio bottoming near 0.69, was followed by a 350% recovery to the 2019 local high and ultimately a multi-thousand-percent run to the 2021 all-time high.
The 2022 signal may prove to be the most well-documented of all, given the unprecedented level of on-chain transparency and the massive growth in the analyst community. With MVRV dipping to 0.71 amid the FTX collapse, the Bitcoin undervalued indicator fired one of its clearest signals of the decade. Those who acted on it witnessed Bitcoin eventually surge past $100,000 in the 2024–2025 cycle—a gain that rewarded patience and data-driven conviction over emotional decision-making.
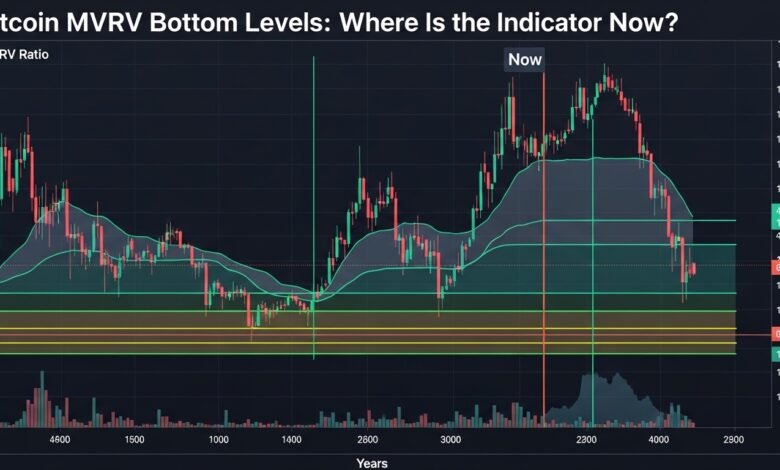
Understanding the Bitcoin MVRV Chart
Visual analysis of the Bitcoin MVRV chart over multiple cycles makes the pattern immediately apparent. The chart overlays the ratio against Bitcoin’s price, with color-coded bands highlighting the different phases: deep red zones below 1.0 representing the bottom accumulation window, green zones in the 1.0–2.5 range representing the constructive phase, and amber/red zones above 3.0 flagging elevated risk and potential cycle tops.
Image file name suggestion: bitcoin-mvrv-bottom-levels-chart.jpg
Image ALT text: Bitcoin MVRV bottom levels historical chart showing cycle lows across 2015, 2018, and 2022
When studying this chart, one of the most striking observations is the shrinking duration of each sub-1.0 period. This compression suggests that as Bitcoin’s market grows, deeper and more sophisticated capital—including institutional buyers—has become more willing to absorb supply at undervalued levels, shortening the window available to retail investors who rely on these Bitcoin bear market indicators to time their entries.
Conclusion
The historical record is clear: Bitcoin MVRV bottom levels have provided some of the most reliable and high-conviction buying signals in the history of financial markets.
While Bitcoin’s MVRV is not currently in bottom territory as of early 2026, understanding where those levels are and how to recognize them when they reappear is one of the most valuable skills an investor can develop. The next cycle bottom will come. When the Bitcoin MVRV ratio once again dips below 1.0—especially into the 0.6 to 0.8 band—history suggests it will be one of the most compelling accumulation opportunities the market has ever offered.
If you found this analysis valuable, start monitoring the Bitcoin MVRV bottom levels on platforms like Glassnode, CryptoQuant, or LookIntoBitcoin today. Subscribe to on-chain analytics newsletters, set alerts for sub-1.0 MVRV readings, and build your investment framework now—before the next bottom arrives. The best time to understand the signal is before you need it.
See more;Bitcoin BTC/USD Second $70k Rejection: Buy the Dip?