Bitcoin BTC/USD Second $70k Rejection: Buy the Dip?
Is Bitcoin's BTC/USD second $70k rejection a buy the dip signal? Explore key indicators, market sentiment, and what analysts say about BTC's next move.

Bitcoin’s BTC/USD second $70k rejection a buying opportunity or a warning sign of deeper losses ahead? For the second time in recent memory, Bitcoin has approached the psychologically charged $70,000 level — only to face aggressive selling pressure that pushed prices back below key support zones. Whether you are a seasoned trader or a long-term holder, this moment demands attention. Understanding the mechanics behind this rejection, the sentiment driving it, and the historical patterns that follow such events could be the difference between a costly mistake and a well-timed entry. In this article, we break down everything you need to know about the current BTC/USD price action, what on-chain data reveals, and whether the case for buying this dip is as strong as the bulls believe.
Bitcoin’s BTC/USD Second $70k Rejection
Bitcoin has a long and documented history of testing resistance levels multiple times before either breaking through decisively or reversing into a prolonged correction. The BTC/USD second rejection at $70,000 is not an isolated event — it is the continuation of a narrative that began when Bitcoin first approached this level during the broader bull cycle. The $70,000 zone has become a battleground between buyers who see it as a launchpad to new all-time highs and sellers who view it as an attractive exit point after a massive run-up from cycle lows.
What makes this second rejection particularly significant is the context in which it occurred. Macroeconomic pressures, including Federal Reserve interest rate expectations and global risk-off sentiment, have created a challenging environment for risk assets like Bitcoin. Simultaneously, on-chain metrics such as exchange inflows and miner selling activity spiked precisely around the $70k level, adding technical weight to the resistance. Traders watching the Bitcoin price chart closely will note that the rejection was accompanied by high trading volume — a classically bearish signal when it occurs at a key resistance zone.
What the BTC/USD Charts Are Telling Us Right Now
From a purely technical standpoint, the BTC/USD price action is drawing significant attention from both retail and institutional traders. The daily chart shows that Bitcoin formed a double-top pattern near the $70,000 resistance, a pattern widely recognized as a bearish reversal signal. The neckline of this pattern sits near the $60,000–$62,000 range, and a confirmed breakdown below this zone could invite a more sustained move to the downside. However, it is equally important to note that Bitcoin’s RSI (Relative Strength Index) on the weekly chart has cooled significantly from overbought readings, suggesting that momentum is resetting rather than fully collapsing. Moving averages, particularly the 50-day and 200-day EMAs, continue to slope upward — a structural bullish signal that separates this correction from more severe downturns seen in previous cycles.
Is Bitcoin’s Second $70k Rejection a “Buy the Dip” Opportunity?
The phrase “buy the dip” has become something of a mantra in the Bitcoin community, but applying it blindly has burned many investors over the years. The real question surrounding Bitcoin’s BTC/USD second $70k rejection is not whether dips are worth buying in theory — they often are — but whether this particular dip has the structural support needed to make it a high-probability trade. Several converging factors suggest the answer may be yes, though significant risks remain that every investor must weigh carefully.
First, Bitcoin halving cycles have historically produced sustained bull markets in the months following the halving event itself. With the most recent halving now behind us, many analysts argue that the full impact of reduced supply issuance has not yet been priced in. Historically, post-halving Bitcoin bull runs have lasted well over a year, suggesting that the broader trend remains intact despite the short-term rejection. Second, institutional Bitcoin adoption continues to accelerate. Spot Bitcoin ETF inflows, while volatile week-to-week, are structurally positive for long-term BTC demand. When large institutions accumulate Bitcoin during price dips, it creates a powerful demand floor that was absent in previous cycles.
Key BTC/USD Support Levels to Watch After the Rejection
Identifying strong support levels is essential for anyone considering entering a Bitcoin buy the dip position. Based on current technical analysis, three primary support zones are worth monitoring closely. The first and most immediate sits at $63,000–$65,000, an area that has served as both support and resistance throughout this cycle. A clean bounce from this zone would reinforce the bullish thesis and attract momentum buyers. The second zone lies between $58,000 and $60,000, which aligns with the 100-day EMA and has seen substantial on-chain accumulation by long-term holders in the past. The third and most critical support sits near $52,000–$55,000 — a level where Bitcoin’s realized price for short-term holders converges with a major horizontal demand zone. A break below this level would fundamentally challenge the post-halving bull market narrative and require a serious reassessment of the macro setup.
On-Chain Data and Market Sentiment Around BTC’s $70k Level
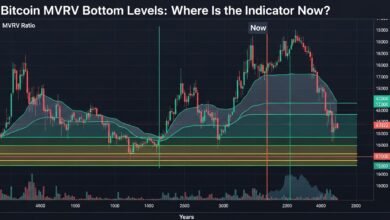
Beyond price charts, on-chain Bitcoin analytics provide a deeper layer of insight into what is truly happening beneath the surface of the BTC/USD second $70k rejection. The NUPL (Net Unrealized Profit/Loss) indicator currently sits in a range consistent with prior mid-cycle corrections rather than a cycle top. This suggests that the majority of Bitcoin holders are still in profit and have not yet reached the euphoric levels of over-extension that typically precede major market reversals. Furthermore, the Bitcoin MVRV ratio — which compares market value to realized value — remains below the historically overheated thresholds seen at previous cycle peaks, adding another layer of support to the “not a top” thesis.
Exchange data is equally compelling. Bitcoin exchange reserves have been on a sustained downtrend over the past two years, meaning that fewer coins are available for immediate selling on centralized platforms. When exchange reserves fall while price undergoes a correction, it often signals that long-term holders are not capitulating — they are simply not selling. This is the behavioral fingerprint of a healthy mid-cycle correction rather than a structural bear market. Whale wallet activity also reflects this, with large addresses showing accumulation patterns during the current dip rather than distribution.
Fear & Greed Index and Sentiment During BTC’s Dip
The Crypto Fear & Greed Index dipped sharply following Bitcoin’s second rejection from $70,000, moving from “Greed” territory into “Fear” — a zone that has historically coincided with attractive buying opportunities for patient investors. Contrarian investors have long used extreme fear readings as a signal to accumulate, based on the premise that market sentiment tends to overcorrect in both directions. Social media activity around BTC price predictions has become noticeably more negative, which is another classic hallmark of a local bottom formation process. While no single sentiment indicator is definitive on its own, the convergence of falling social volume, rising fear readings, and on-chain accumulation creates a setup that many experienced traders recognize as a potential inflection point.
What Top Analysts Say About the BTC/USD Rejection and Recovery
Prominent voices in the cryptocurrency analysis space have offered a range of perspectives on the Bitcoin $70k rejection. Bullish analysts point to the structural similarity between the current correction and the mid-cycle consolidation phases observed in the 2016–2017 and 2020–2021 bull markets. In both of those cycles, Bitcoin experienced 30–40% corrections after initial surges before resuming its upward trajectory and ultimately reaching new all-time highs. If the same playbook holds, the current dip could represent one of the last major buying opportunities before Bitcoin pushes toward the $100,000 milestone that many cycle models project.
More cautious analysts, however, warn that macroeconomic headwinds in 2024–2025 are meaningfully different from prior cycles. Interest rates remain elevated relative to the near-zero environment that fueled the 2020–2021 Bitcoin bull market. Additionally, regulatory uncertainty in key markets continues to create unpredictable demand shocks. These analysts recommend a dollar-cost averaging (DCA) strategy rather than a lump-sum entry, allowing investors to spread their risk across multiple price points in case the correction extends further than current models suggest. Regardless of which camp proves correct, most analysts agree that Bitcoin’s long-term value proposition remains intact and that the asset’s fundamental scarcity continues to strengthen over time.
Risk Management Strategies for Bitcoin Dip Buyers
Even if the BTC/USD second $70k rejection does turn out to be a generational buying opportunity, entering any trade without a proper risk management framework is reckless. The first rule of dip buying in volatile assets like Bitcoin is to never allocate more capital than you can afford to lose entirely. Position sizing is arguably more important than entry timing in the long run. A well-sized position allows you to hold through further volatility without being forced to sell at the worst possible moment.
Setting a clear stop-loss level before entering any trade is equally non-negotiable. For buyers entering after Bitcoin’s second $70k rejection, a stop below the $52,000 major support zone would give the trade room to breathe while protecting against a catastrophic loss if the bull market thesis is invalidated. Diversifying within the cryptocurrency market itself — rather than going all-in on BTC alone — can also reduce portfolio volatility during uncertain periods. Finally, maintaining a cash reserve to average down into Bitcoin if prices fall further is a strategy used by many successful long-term investors who view short-term volatility as opportunity rather than threat.
Historical Parallels: When Bitcoin Rejected Key Levels Before
History may not repeat perfectly in financial markets, but it rhymes with remarkable frequency. Looking back at Bitcoin’s price history, there are several instructive parallels to the current BTC/USD rejection at $70,000. In 2017, Bitcoin rejected the $3,000 level multiple times before breaking above it and eventually surging to nearly $20,000. In 2020, the $10,000–$12,000 zone was tested and rejected on three separate occasions before Bitcoin finally broke through and embarked on a six-month rally to $65,000. Each of these rejections was followed by a period of uncertainty, bearish media coverage, and liquidations — the same dynamics we are observing today around the $70,000 threshold.
The key lesson from these historical episodes is that multi-test resistance levels are not necessarily signs of weakness — they are often the precursor to the most explosive breakouts. Each test of resistance educates the market, washes out weak hands, and ultimately builds the structural base needed for a sustainable upside move. Investors who understood this dynamic and bought the dips during prior rejection phases were rewarded handsomely when Bitcoin finally broke above resistance with conviction.
Conclusion
The Bitcoin BTC/USD second $70k rejection is undeniably a pivotal moment for the crypto market. On one hand, multiple converging signals — post-halving cycle dynamics, on-chain accumulation patterns, falling exchange reserves, and historical resistance-to-support conversions — build a compelling case for the bulls. On the other hand, macroeconomic uncertainties and the technical damage inflicted by the double-top pattern deserve serious respect. No one can predict with certainty whether Bitcoin will bounce decisively from current levels or whether the correction will deepen toward lower support zones before the next leg up materializes.
What we can say with confidence is that informed, risk-managed participation in Bitcoin during major corrections has historically produced strong long-term results. If you believe in Bitcoin’s long-term value thesis — and the fundamentals strongly support that belief — then the BTC/USD second $70k rejection may indeed be the “buy the dip” opportunity that many investors will look back on as a defining moment. Do your own research, manage your risk responsibly, and consider a systematic DCA approach to capitalize on this potential opportunity.
Ready to take action? Track real-time BTC/USD price movements, set your key support alerts, and start building your Bitcoin position with a disciplined risk management strategy today.
Related Keywords & Search Terms People Also Ask
LSI & Semantic Keywords used in this article: Bitcoin buy the dip strategy, BTC/USD price analysis, Bitcoin $70k resistance, Bitcoin halving cycle 2024, Bitcoin on-chain data, Bitcoin Fear and Greed Index, Bitcoin double top pattern, BTC support levels, Bitcoin institutional adoption, Bitcoin MVRV ratio, Bitcoin realized price, Bitcoin exchange reserves, Bitcoin whale accumulation, crypto market sentiment, Bitcoin technical analysis, Bitcoin bull market 2024–2025, Bitcoin dollar-cost averaging, Bitcoin price prediction, cryptocurrency risk management, Bitcoin long-term value.
See more: Bitcoin price today slips toward $91k on Fed angst