Bitcoin Price Support Gap: $70K-$80K Zone Analysis
Analyzing Bitcoin's critical $70,000-$80,000 price support gap and what it means for traders navigating this unprecedented territory
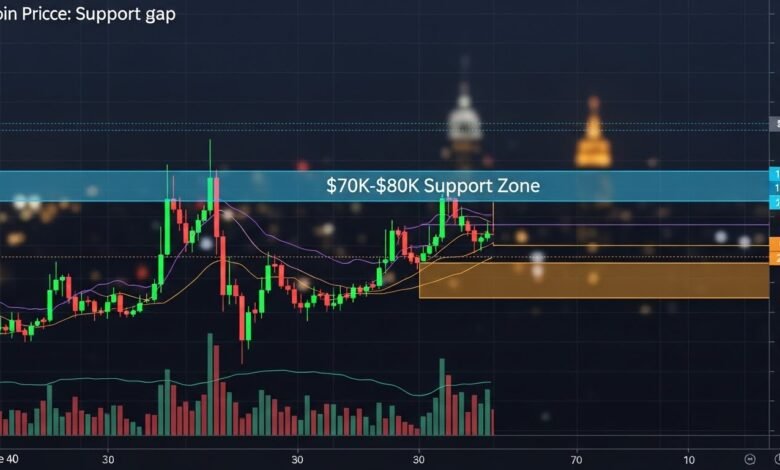
The cryptocurrency market has entered uncharted territory as Bitcoin trades within the Bitcoin price support gap between $70,000 and $80,000, revealing a fascinating challenge for traders and investors alike. This zone represents a unique phenomenon in Bitcoin’s trading history where minimal historical price support exists, creating uncertainty about how the digital asset might behave in this range. Understanding this Bitcoin price support gap becomes crucial for anyone navigating today’s volatile cryptocurrency landscape, as traditional technical analysis tools face limitations when historical reference points simply don’t exist in meaningful quantities.
The significance of this Bitcoin price support gap cannot be overstated. Throughout Bitcoin’s remarkable journey from pennies to tens of thousands of dollars, the cryptocurrency has established clear support and resistance levels at various price points through repeated testing. However, the $70,000 to $80,000 zone represents a relatively brief passage in Bitcoin’s price discovery phase, meaning the asset spent minimal time accumulating trading data in this critical range before pushing higher or retreating lower.
Bitcoin’s Historical Price Structure
Bitcoin’s price evolution tells a story of dramatic rallies, devastating corrections, and gradual institutional adoption. Each major cycle has left behind distinct support levels that traders reference when making decisions. The cryptocurrency support levels below $60,000 are particularly well-established, with zones around $30,000, $40,000, and $50,000 having been tested multiple times across different market cycles.
The BTC historical data reveals that strong support zones typically form where Bitcoin consolidates for extended periods or where significant buying interest repeatedly emerges. These areas become psychological anchors for market participants, creating self-fulfilling prophecies as traders buy dips near proven support levels. The $20,000 level, for instance, served as both fierce resistance in 2017 and later became crucial support during the 2021-2022 bear market.
When Bitcoin first breached $70,000 during its previous bull run, the move happened relatively quickly as momentum traders and institutional buyers drove prices higher with conviction. This rapid ascent meant minimal time spent establishing robust Bitcoin trading zones through consolidation and sideways price action. The consequence is clear in today’s market structure analysis: the $70,000 to $80,000 range lacks the deep liquidity pools and repeated testing that characterize stronger support zones below.
The Technical Implications of Limited Price History
From a technical analysis perspective, the Bitcoin price support gap creates several challenges for traders attempting to identify reliable entry and exit points. Traditional support and resistance analysis relies on historical price action to identify zones where buyers and sellers have previously shown strong interest. When that history is sparse, as it is in the $70,000 to $80,000 zone, the predictive power of these tools diminishes significantly.
The cryptocurrency price action within this range becomes more susceptible to volatility and sudden movements because there are fewer established participants with positions accumulated at these levels. Strong support typically exists where many market participants hold positions and are motivated to defend those price levels. In the absence of such positioning, Bitcoin market structure becomes more fragile, and price movements can be more dramatic in either direction.
Volume profile analysis further confirms the Bitcoin price support gap concern. This advanced technical tool shows the distribution of trading volume across different price levels, revealing where the most significant transactions occurred. When examining Bitcoin’s volume profile, the $70,000 to $80,000 zone shows noticeably thinner volume compared to ranges both above and below, indicating fewer participants with vested interests at these specific price points.
The implications extend to order book depth as well. Modern cryptocurrency exchanges provide real-time visibility into pending buy and sell orders at various price levels. Analysis of aggregated order book data across major exchanges reveals that digital asset support in the $70,000 to $80,000 range is materially thinner than in more heavily traded zones, suggesting that large market movements could occur with relatively less capital required to push prices through this range.
Market Psychology and the Support Gap Challenge
Market psychology plays an enormous role in how the Bitcoin price support gap manifests in real trading conditions. Experienced traders understand that support and resistance levels are ultimately psychological constructs that become real through collective market behavior. When Bitcoin trades in the $70,000 to $80,000 zone, participants lack the psychological anchors that well-established support provides.
This psychological uncertainty manifests in several ways. First, traders who missed earlier accumulation opportunities may hesitate to enter positions in this range, uncertain whether they’re catching a falling knife or establishing positions ahead of further gains. This hesitation reduces buying pressure that might otherwise stabilize prices. Second, existing holders who accumulated Bitcoin at lower prices may view this range as an opportunity to take profits, particularly if they lack confidence in strong support preventing further declines.
The Bitcoin price consolidation patterns that typically emerge when the asset trades within well-established ranges tend to be shorter-lived and less reliable in the support gap zone. Consolidation requires a balance between buying and selling pressure, with participants on both sides confident enough in their positions to maintain them. In zones lacking historical validation, this confidence evaporates more quickly, leading to breakouts or breakdowns that occur with less warning.
Fear and greed, the two dominant emotions driving cryptocurrency markets, become amplified within the Bitcoin price support gap. During periods of optimism, the thin resistance above can fuel rapid rallies as buyers encounter minimal selling pressure from those looking to exit at breakeven levels. Conversely, during fearful periods, the lack of proven support below current prices can accelerate selling as traders rush to exit positions before potential further declines.
Comparing Bitcoin’s Current Position to Previous Cycles
The 2020-2021 cycle showed similar patterns, though with some important differences. As institutional adoption accelerated, Bitcoin’s price action became somewhat less volatile, with longer consolidation periods at key levels. However, even during this more mature cycle, certain price ranges saw minimal consolidation time. The rapid move from $40,000 to $60,000 in early 2021 created a zone that later proved problematic when Bitcoin corrected from its all-time highs.
What distinguishes the current cryptocurrency support levels situation is Bitcoin’s evolution into a more widely recognized asset class. The presence of spot Bitcoin ETFs, increased institutional holdings, and broader retail adoption means the market structure differs fundamentally from previous cycles. These factors could potentially strengthen support in the $70,000 to $80,000 zone despite limited historical price action, as new classes of buyers may view these levels as attractive entry points based on different analytical frameworks.
The Bitcoin trading zones established during previous cycles took months or years to develop their characteristic strength. The $10,000 level, which seemed impossibly high in 2017, became a critical support and resistance battleground during the 2019-2020 period, tested repeatedly until it became a reliable technical level. The current $70,000 to $80,000 zone hasn’t yet undergone this seasoning process, creating uncertainty about its reliability as support should Bitcoin correct from higher levels or as resistance should it approach from below.
Strategic Considerations for Traders and Investors
Dollar-cost averaging becomes particularly relevant when dealing with the cryptocurrency price action within support gaps. Rather than committing large amounts of capital at specific price points within the $70,000 to $80,000 zone, gradual accumulation across the entire range helps mitigate the risk of entering at precisely the wrong moment. This strategy acknowledges uncertainty while maintaining exposure to potential upside.
Options and derivatives markets offer additional tools for managing risk within the Bitcoin price support gap. Put options can provide downside protection for holders concerned about potential drops through the weakly supported zone, while call options allow speculative participation without committing full capital. The derivatives market itself provides valuable information about where sophisticated traders expect Bitcoin to trade, with implied volatility metrics revealing market expectations for price movement magnitude.
For long-term investors focused on Bitcoin’s multi-year trajectory rather than short-term trading, the digital asset support question becomes less critical. Those with conviction in Bitcoin’s long-term value proposition may view the $70,000 to $80,000 range as simply another step in the asset’s maturation journey, recognizing that today’s uncertain zones may become tomorrow’s well-established support through the simple passage of time and additional trading activity.
The crypto resistance levels above the current support gap also merit consideration in strategic planning. If Bitcoin successfully establishes support in the $70,000 to $80,000 zone through extended consolidation, it would create a stronger foundation for potential moves toward the psychological $100,000 level. Understanding the interplay between support below and resistance above helps traders develop more comprehensive market views.
Institutional Influence on Modern Support Levels
The role of institutional participants in shaping Bitcoin market structure has grown dramatically since previous market cycles. Spot Bitcoin ETFs, corporate treasuries holding BTC, and institutional trading desks bring different behavioral patterns compared to retail traders. These participants often employ systematic strategies with predefined entry and exit points based on portfolio allocation models rather than technical chart patterns.
This institutional presence could fundamentally alter how the Bitcoin price support gap develops over time. Large institutions typically accumulate positions gradually to avoid moving markets against themselves, spreading purchases across weeks or months. This methodical approach creates sustained buying pressure that can establish support even in historically untested price ranges. The question remains whether institutional interest is sufficiently strong in the $70,000 to $80,000 zone to create robust support organically.
Corporate treasuries holding Bitcoin, such as MicroStrategy and others, generally view their holdings as long-term strategic assets rather than trading positions. These strong hands remove supply from the market, potentially creating scarcity that supports higher prices. However, their influence on intraday or even intraweek cryptocurrency support levels remains limited since they typically don’t actively defend specific price levels through tactical buying.
Institutional derivatives trading adds another dimension to the Bitcoin technical analysis landscape. Large players often hedge their spot holdings with derivatives positions, creating complex interactions between spot and futures markets. These hedging activities can either stabilize or destabilize prices in weakly supported zones, depending on the specific positioning of major market participants and the mechanics of their hedge portfolios.
On-Chain Metrics and Support Zone Validation
Blockchain analysis provides unique insights into the BTC historical data that traditional technical analysis cannot access. On-chain metrics reveal where Bitcoin holders accumulated their positions, how long they’ve held those positions, and at what profit or loss they’re currently sitting. This information helps assess the strength of support zones beyond simple price chart analysis.
The UTXO (Unspent Transaction Output) age distribution shows when Bitcoin at various addresses last moved. Analysis of this data reveals that relatively few Bitcoin units last changed hands in the $70,000 to $80,000 range, confirming the Bitcoin price support gap from an on-chain perspective. This means fewer holders have cost bases in this zone who might be motivated to defend those levels through additional buying during corrections.
Realized price metrics, which weight Bitcoin by the price at which each unit last moved, provide another lens for understanding support. The realized price currently sits well below the $70,000 to $80,000 zone for most of the Bitcoin supply, suggesting that the average holder enjoys substantial unrealized profits. This profit cushion could make holders more willing to weather volatility in the support gap zone rather than panic selling at the first sign of weakness.
Exchange flow data reveals how Bitcoin moves between cold storage and exchange wallets, providing leading indicators of potential selling or buying pressure. During periods when Bitcoin trades in the Bitcoin price consolidation range between $70,000 and $80,000, monitoring these flows becomes particularly valuable. Large transfers to exchanges might signal impending selling pressure that weak support couldn’t withstand, while movements to cold storage suggest conviction among holders.
Future Scenarios and Market Evolution
Looking forward, several scenarios could play out regarding the Bitcoin price support gap between $70,000 and $80,000. In a bullish scenario, Bitcoin might spend an extended time consolidating in this range, gradually establishing robust support through repeated testing and sustained trading activity. This consolidation would fill the current gap with meaningful volume and participation, creating the foundation for subsequent moves higher.
Alternatively, Bitcoin might trade through this range relatively quickly again, either pushing toward six figures or correcting back toward more established cryptocurrency support levels below $70,000. In this scenario, the gap would persist, potentially creating challenges during future market cycles when Bitcoin eventually returns to test these levels from above or below.
The maturation of crypto resistance levels and support zones is an ongoing process that reflects Bitcoin’s evolution from speculative experiment to established asset class. As regulatory clarity improves, institutional adoption expands, and market infrastructure develops, Bitcoin’s price action may naturally become more stable and predictable. This evolution could accelerate the development of reliable support in currently uncertain zones.
Macroeconomic factors will undoubtedly influence how the digital asset support structure develops in the coming months and years. Monetary policy decisions, inflation trajectories, and traditional market performance all impact cryptocurrency prices. The $70,000 to $80,000 zone’s role in Bitcoin’s broader price structure will partly depend on whether these macro conditions support sustained higher prices or force corrections back to more thoroughly tested levels.
Learning from Altcoin Support Gap Patterns
Examining how other cryptocurrencies have handled similar cryptocurrency price action challenges provides a useful perspective. Major altcoins like Ethereum have experienced their own support gaps during rapid price discovery phases. Some of these gaps were eventually filled through consolidation and repeated testing, while others remained weak points in market structure that became evident during subsequent corrections.
The key lesson from altcoin patterns is that support gaps don’t automatically fill or strengthen over time. Active trading, sustained interest, and compelling fundamental reasons for accumulation are necessary for weak zones to transform into strong support. Without these catalysts, gaps can persist indefinitely, creating ongoing technical challenges that traders must navigate.
Conclusion
The Bitcoin price support gap between $70,000 and $80,000 represents both a challenge and an opportunity for market participants willing to adapt their strategies. Understanding this gap’s existence and implications allows traders to make more informed decisions, sizing positions appropriately and setting realistic expectations for price behavior in this range. As Bitcoin continues its remarkable journey toward mainstream adoption, zones like this will continue to emerge during rapid price discovery phases, requiring vigilance and flexibility from those seeking to profit from the world’s leading cryptocurrency.
Whether you’re a long-term investor accumulating Bitcoin for its monetary properties or an active trader seeking short-term profits, recognizing the technical realities of the Bitcoin price support gap enables better risk management and strategic planning. The cryptocurrency market rewards those who combine fundamental conviction with technical awareness, adapting to market structure realities while maintaining focus on longer-term opportunities.
See more;Standard Chartered Cuts Bitcoin Forecast: 2025 Crypto Market Update