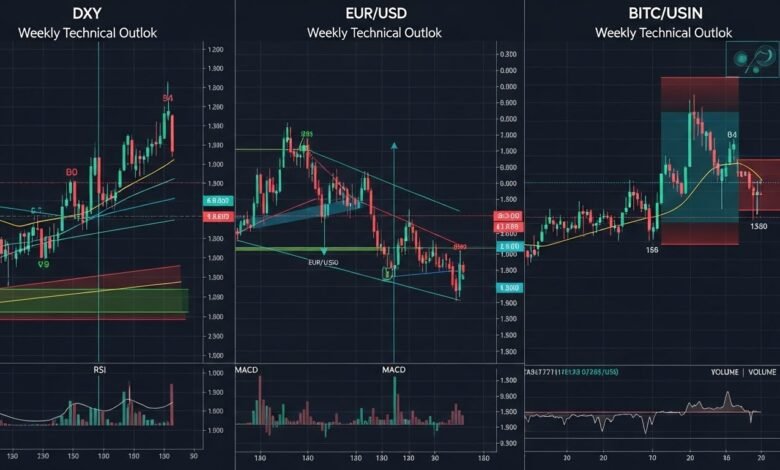
DXY, EUR/USD & Bitcoin Weekly Technical Outlook
Fresh weekly technical outlook on DXY, EUR/USD, USD/JPY, Gold, Bitcoin and Oil, with key levels, trends and trading scenarios for active market participants.
Every trading week brings a new set of opportunities and risks across the major markets. The DXY, EUR/USD, USD/JPY, Gold, Bitcoin and Oil are at the core of global capital flows, risk sentiment and hedging decisions. When you understand how these markets are positioned technically, you gain a clearer framework for trade planning, risk management and scenario building.
This DXY, EUR/USD, USD/JPY, Gold, Bitcoin, Oil weekly technical outlook brings all of those assets together in one place. Instead of looking at each chart in isolation, we explore how they interact, where key support and resistance zones sit, and which price areas are likely to attract liquidity and volatility.
We will walk through each market using classic technical analysis tools such as trendlines, moving averages, swing highs and lows, and common momentum indicators like RSI. The goal is not to provide “signals”, but to help you build a structured view so you can decide whether you want to buy dips, sell rallies, or stay on the sidelines.
As always, markets move quickly, so use this outlook as a roadmap, then confirm all levels and patterns on your own charts before placing trades.
Macro Context: The Big Picture Behind This Week’s Charts
Before diving into individual instruments, it is useful to set the bigger context. The US dollar index (DXY) is still the anchor for global FX. When the dollar strengthens, it tends to pressure EUR/USD and Gold, and sometimes weigh on Bitcoin and Oil, especially when the move is driven by interest-rate expectations and risk aversion.
On the other hand, when the dollar weakens and global risk appetite improves, high beta assets such as Bitcoin, growth stocks and even crude oil tend to attract buyers, while EUR/USD and other major FX pairs may attempt recoveries.
At the same time, real yields, inflation data and central bank communication shape the medium-term trend in Gold, while geopolitics and supply dynamics are key for Oil. Your weekly trading plan should always tie these fundamentals back into the technical picture.
DXY Weekly Technical Outlook
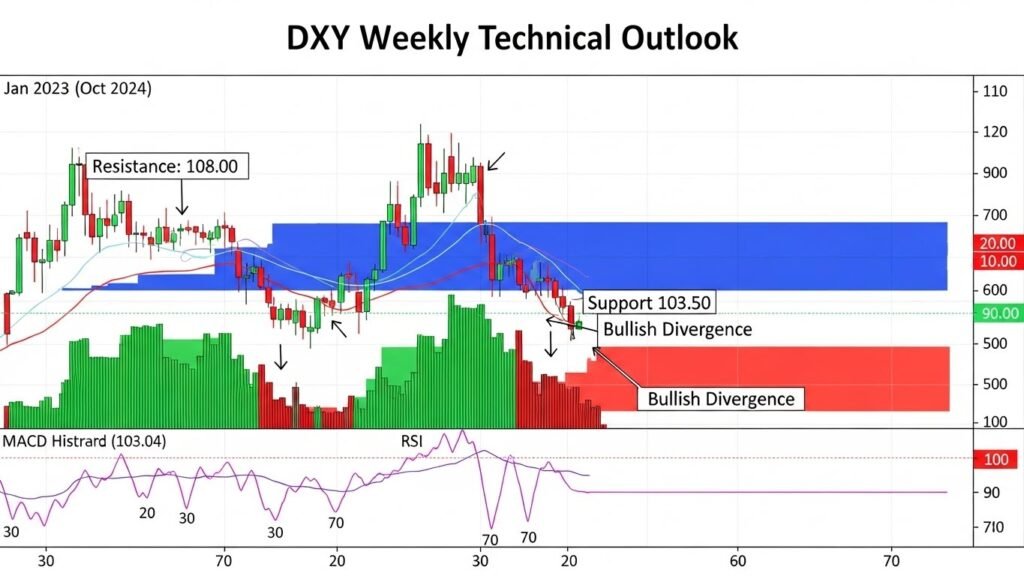
DXY Trend Structure and Momentum
The US Dollar Index (DXY) remains the primary gauge of broad USD strength. On the weekly timeframe, traders are watching whether DXY is holding above its main rising trendline drawn from prior swing lows. As long as price trades above that trendline and above its mid-range moving averages (for example, the 50-day and 100-day), the bias leans toward a bullish or at least supportive dollar tone.
If the RSI on the daily or weekly chart is hovering in neutral to mildly overbought territory, it signals that bullish momentum is present but not yet exhausted. A flattening RSI near the 50 level usually points to a consolidation phase, where DXY may move sideways in a range before choosing the next directional leg.
If DXY is trading closer to resistance, the risk–reward may favor cautious dollar longs or even short-term mean reversion trades, provided you see rejection wicks, bearish candles, or divergence on RSI. If it is sitting near support, dollar bulls will be watching for higher lows and clean bullish candlestick patterns to confirm the next leg higher.
Trading Implications for DXY
For active traders, the DXY itself is often a guide rather than a direct trading instrument. A firm DXY backdrop tends to support USD/JPY and weigh on EUR/USD and Gold, whereas a softening DXY can fuel euro recoveries, gold bounces and risk-asset rallies, including Bitcoin and Oil.
In short, keep a close watch on whether DXY breaks out of its range or respects its key support and resistance levels. That will heavily influence the rest of this weekly technical outlook.
EUR/USD Weekly Technical Outlook
EUR/USD Trend and Price Action
The EUR/USD pair remains one of the most actively traded instruments in the world. On the weekly chart, traders are focused on whether the euro is in a clear downtrend, attempting a trend reversal, or locked in a broad sideways range against the dollar.
If price is trading below a falling 200-day moving average and below a descending trendline drawn from previous peaks, the structural bias is still lower. In that environment, rallies into resistance zones are often viewed as selling opportunities rather than trend changes.
However, if EUR/USD has started to post higher lows, break above a short-term moving average cluster, and hold above recent resistance-turned-support, the market may be in the early stages of a bullish correction or even a larger upside reversal.
Key EUR/USD Support and Resistance Levels
A robust EUR/USD weekly technical outlook usually revolves around three main zones:
First, a key support area near the latest swing lows, where buyers previously defended the pair. A clean break and close below that region on the daily or weekly timeframes would signal renewed euro weakness and open the door to deeper downside.
Second, a mid-range zone around recent consolidation, where the pair has spent a lot of time. This is often a battle area between buyers and sellers and can serve as a launchpad for the next move.
Third, a major resistance region near prior highs or a descending trendline. A weekly close above this area often signals that the euro is gaining traction and that the broader market sentiment is shifting away from the dollar.
Strategy Notes for Euro Traders
In the context of this DXY, EUR/USD, USD/JPY, Gold, Bitcoin, Oil weekly technical outlook, EUR/USD should be viewed through the lens of the dollar index. If DXY is firm and EUR/USD is capped under resistance, the path of least resistance may still be lower, favoring sell-the-rally setups.
Conversely, if DXY starts to roll over from resistance and EUR/USD holds above recent lows with rising momentum, traders may begin to look for buy-the-dip opportunities, targeting previous swing highs. Confirmation from volume, candlestick structure and indicators such as MACD can add weight to the bias.
USD/JPY Weekly Technical Outlook
USD/JPY Trend Bias and Yield Dynamics
The USD/JPY pair is heavily influenced by interest-rate differentials between US and Japanese bonds. When US yields rise, USD/JPY often pushes higher as carry trades become more attractive. When yields drop or risk aversion spikes, the Japanese yen can strengthen sharply as investors unwind risk.
On the weekly chart, a strong uptrend is characterized by a series of higher highs and higher lows, with price respecting rising moving averages. If USD/JPY is still above its primary trendline and long-term moving average, the broader bias remains bullish, even if short-term pullbacks occur.
Key Levels and Potential Reversal Signals in USD/JPY
For USD/JPY weekly technical outlook, mark a support zone around the last significant pullback low. If price revisits this region and prints a strong bullish rejection, it can offer an interesting risk-defined area for trend-following longs.
On the flip side, the latest major high acts as critical resistance. If USD/JPY fails to break this high and starts posting lower highs, with RSI divergence or a break of short-term structure, it may signal an upcoming correction or even a larger reversal.
Trading Considerations for Yen Traders
USD/JPY tends to move quickly when sentiment shifts. Trend followers may favor buying dips as long as the pair trades above long-term support, while contrarian traders might look for exhaustion patterns near extremes.
Within this DXY, EUR/USD, USD/JPY, Gold, Bitcoin, Oil weekly technical outlook, watch how USD/JPY reacts to swings in DXY and global risk sentiment, since sharp risk-off phases often trigger yen strength across the board.
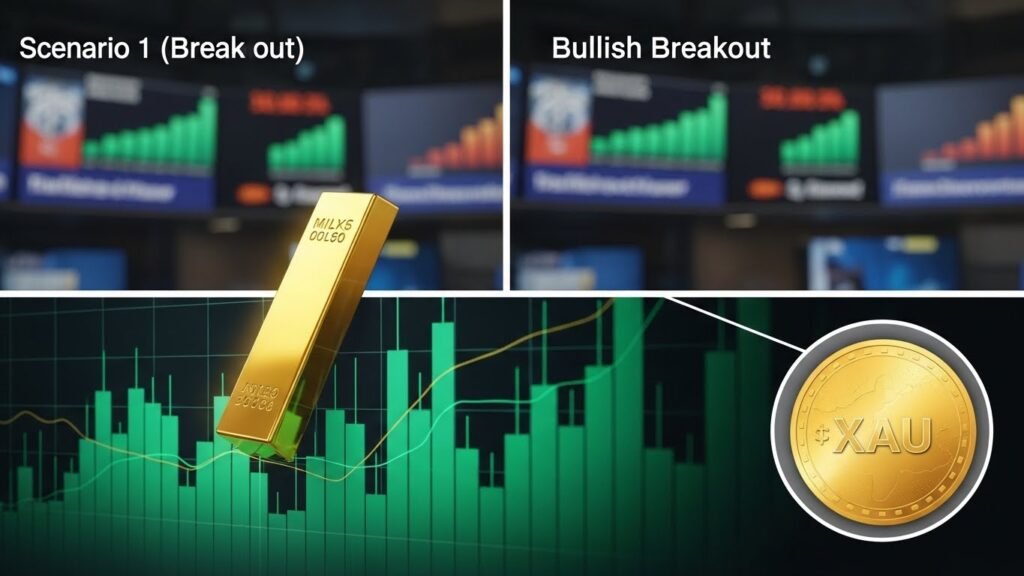
Gold Weekly Technical Outlook
Gold’s Role as a Safe Haven and Inflation Hedge
Gold (XAU/USD) remains a core asset for traders looking for a hedge against inflation, currency debasement and systemic risk. It tends to benefit when real yields fall, the dollar weakens, or market stress increases. However, during sharp liquidity events, gold can also sell off as traders rush to cash, so context always matters.
On the technical side, gold often trades in broad channels and ranges, with long periods of consolidation followed by sudden breakouts. Identifying the current pattern is key to building a realistic Gold weekly technical outlook.
Gold Support, Resistance and Trendlines
The main levels to watch include:
A major support base around the most recent multi-week low, where buying demand has repeatedly stepped in. As long as gold holds this base, the downside is somewhat contained.
A mid-range consolidation zone, where price fluctuates but fails to trend strongly. In this zone, fading extremes can sometimes work, but traders must be nimble.
A major resistance ceiling near previous spikes or all-time highs. A clean weekly close above that resistance, accompanied by rising volume and strong momentum, can signal the start of a new bullish leg.
Gold Trading Scenarios for the Week
If DXY is softening and yields are stabilizing or moving lower, gold may attempt an upside push from support toward resistance, favoring a buy-on-dip mindset within a defined risk range.
If the dollar is strong and yields remain elevated, gold may stay capped below resistance or drift lower within its range. In that scenario, sell-the-rally setups become more attractive, especially near the top of the current trading band.
Always confirm this Gold weekly technical outlook with your own chart levels, since gold is highly sensitive to headlines and macro data.
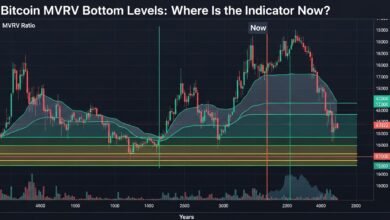
Bitcoin Weekly Technical Outlook
Bitcoin’s Trend and Market Structure
Bitcoin (BTC/USD) sits at the intersection of technology, macro and speculation. Its weekly chart often shows extended trending phases followed by deep corrections. Traders typically watch whether BTC is above or below key levels such as major psychological prices and long-term moving averages.
When Bitcoin trades above a rising 200-day moving average and prints higher highs and higher lows, the broader structure is bullish. Deep pullbacks toward support can then offer opportunities for long-biased traders, provided they manage risk for crypto’s high volatility.
If BTC has broken below key moving averages and is making lower highs and lower lows, the environment is more bearish or range-bound, and traders may prefer shorter-term mean-reversion strategies or stay patient for clearer structure.
Support, Resistance and Volatility Clusters in BTC
In this Bitcoin weekly technical outlook, focus on three types of levels:
A strong support floor where previous sell-offs have been absorbed. If BTC repeatedly bounces from that area, it signals that long-term buyers see value there.
A central value area or trading range, where price rotates frequently. This zone often represents fair value for the current cycle and may produce choppy conditions.
A critical resistance cap near previous cycle highs or big round numbers. Breaks of this zone can trigger aggressive short covering and momentum buying, launching Bitcoin into a new phase of the cycle.
Implications for Crypto Traders
Bitcoin’s relationship with DXY is not always stable, but during strong risk-on phases, a weaker dollar and supportive liquidity backdrop often coincide with Bitcoin uptrends. During risk-off periods, BTC can behave more like a high-beta asset, selling off along with equities.
Traders using this DXY, EUR/USD, USD/JPY, Gold, Bitcoin, Oil weekly technical outlook should treat Bitcoin separately in terms of volatility and position sizing, while still respecting how macro flows and dollar strength can influence its path.
Oil Weekly Technical Outlook
Oil Fundamentals and Technical Backdrop
Crude oil remains a key barometer for global growth, demand expectations and geopolitical risk. From a technical analysis perspective, Oil often trades in extended trending waves, driven by supply cuts, inventory data and macro sentiment, followed by stretches of sideways action where the market digests prior moves.
On the weekly chart, look at whether Oil is respecting a rising channel or has broken into a wider consolidation. A sequence of higher lows and higher highs, with price above its key moving averages, indicates a constructive bias. A breakdown from that structure suggests the market is reassessing demand or pricing in weaker growth.
Key Support and Resistance in Oil
Oil traders should mark a clear support region near recent pullback lows and prior breakout zones. If this area continues to hold, it provides a reference point for risk management and potential long entries.
Similarly, identify a resistance band near prior peaks or strong supply zones where selling pressure emerged in the past. A weekly close above that region can mark the start of a new bullish leg, while repeated failures there may lock oil into a broad range or trigger corrective moves.
Trading Perspective for the Week
In the context of our Oil weekly technical outlook, a strong dollar and concerns about global growth often cap oil rallies, while improving risk sentiment and production cuts can support higher prices.
Traders may prefer to buy pullbacks toward support when fundamental and technical factors align, or fade spikes into resistance when macro headwinds strengthen. As always, oil’s sensitivity to geopolitical headlines means traders need to stay flexible and avoid oversized positions.
Cross-Market Themes and Correlations
Bringing everything together, this DXY, EUR/USD, USD/JPY, Gold, Bitcoin, Oil weekly technical outlook highlights a few key cross-market themes:
A firm DXY generally pressures EUR/USD and Gold, while supporting USD/JPY. A softer dollar tends to aid EUR recoveries, gold rallies and potentially risk assets like Bitcoin and Oil.
If yields and risk sentiment support carry trades, USD/JPY may stay elevated, and risk assets can perform well. If risk sentiment deteriorates sharply, you may see yen strength, pressure on equities and crypto, and a mixed response in gold and oil depending on whether the shock is inflationary or growth-related.
Understanding these correlation patterns helps you avoid conflicting positions, such as being heavily long dollar and simultaneously expecting strong upside in gold and EUR/USD without a clear macro justification.
Conclusion
This DXY, EUR/USD, USD/JPY, Gold, Bitcoin, Oil weekly technical outlook has outlined the major trend structures, key support and resistance zones, and likely trading scenarios for the coming days.
The core ideas are:
DXY sets the tone for FX and often influences gold and risk assets.
EUR/USD and USD/JPY reflect both dollar strength and local dynamics such as European growth and Japanese yield policy.
Gold serves as a hedge and range-trading candidate when macro uncertainty is high.
Bitcoin remains a high-volatility market driven by liquidity and sentiment cycles.
Oil mirrors the balance between demand expectations, supply decisions and geopolitics.
Use these levels and structures as a framework, not a rigid script. Always confirm the latest price action on your own charts, align your trades with your risk tolerance and time horizon, and be prepared to adapt if the market breaks out of established patterns.
FAQs
Q. How often should I update my weekly technical outlook?
Most traders review their weekly technical outlook at the start of each trading week, then refine it daily as new candles form and data is released. The bigger structure on the weekly chart does not change quickly, but intraday developments can shift short-term bias and trigger entries or exits.
Q. Which timeframe is best for trading DXY, EUR/USD, USD/JPY, Gold, Bitcoin and Oil?
There is no single “best” timeframe. Many traders use the weekly and daily charts to define the main trend and support and resistance, then drop down to the 4-hour or 1-hour charts to fine-tune entries and exits. The key is to stay consistent with your process and ensure your trade horizon matches your timeframe.
Q. How important are indicators like RSI and moving averages in this outlook?
Indicators such as RSI, MACD and moving averages help quantify trend strength, momentum and potential reversal areas. In this DXY, EUR/USD, USD/JPY, Gold, Bitcoin, Oil weekly technical outlook, they are used as confirmation tools rather than standalone signals. Price action and structure come first; indicators should support, not replace, your chart reading.
Q. Can I trade all these markets at once?
You can, but risk management becomes more complex. Since DXY, EUR/USD, USD/JPY, Gold, Bitcoin and Oil are often correlated, holding multiple positions that all rely on the same macro theme (for example, a weaker dollar) can magnify your exposure. Many traders prefer to focus on a few of the cleanest setups each week to keep risk under control.
Q. Is this weekly outlook financial advice or guaranteed to be accurate?
No. This weekly technical outlook is for educational and informational purposes only. It is not financial advice, a recommendation to buy or sell any instrument, or a guarantee of future performance. Markets are uncertain, and prices can move sharply on unexpected news. Always do your own analysis, test your assumptions and consult a qualified professional if you need personalized investment advice