
Bitcoin News Today: BTC Price Slides, But Analysts See Bottom Signals
Bitcoin news today: BTC price slides to multi-month lows as ETFs see outflows, but on-chain and technical signals hint at a potential market bottom.
BTC Price Slides. After hitting record highs above $120,000 in early October, Bitcoin has tumbled dramatically. In just a matter of weeks, BTC has shed more than a third of its value, plunging from roughly $125,000 to the low–$80,000 range at one point, marking its weakest levels in about seven months. As of now, the BTC price hovers around $87,000–$88,000, still under heavy pressure but slightly above the recent lows.
This sell-off has triggered billions of dollars in liquidations, record outflows from leading Bitcoin ETFs, and growing fear that the bull market might be over. At the same time, several key on-chain metrics, technical indicators and macro factors are flashing what many analysts view as classic bottom signals. Some experts argue that what we’re seeing in Bitcoin news today is not the end of the cycle, but a painful reset that often precedes the next leg higher. In this in-depth BTC price analysis, we will break down what is driving the current slide, which technical and on-chain indicators are hinting at a floor, and what traders should watch if they are trying to navigate this volatile phase. BTC Price Slides.
Bitcoin News Today: Where the BTC Price Stands

In early October, Bitcoin set a fresh all-time high near $125,000, fueled by strong spot ETF demand, renewed institutional interest, and a wave of optimism around crypto adoption. However, the rally proved unsustainable. As macro uncertainty intensified and risk assets started to wobble, Bitcoin began to unwind.The crypto market sentiment has shifted from euphoria to fear in record time. Retail traders are increasingly cautious, and many short-term speculators have been shaken out. Yet despite the dramatic BTC price drop, Bitcoin is still trading far above its levels from early 2024, when institutional ETF inflows first kicked off the latest bull phase.This tension between short-term pain and long-term gains is a big reason analysts are now focusing on whether this zone might become a structural bottom. BTC Price Slides.
Macro Uncertainty and Risk-Off Sentiment
Bitcoin’s sell-off hasn’t happened in isolation. Risk assets across the board have faced pressure as investors reassess the outlook for interest rates, inflation and growth. Concerns about the sustainability of an AI-driven stock rally, mixed economic data, and shifting expectations around future central bank moves have all contributed to a broader risk-off environment. When market uncertainty spikes, many institutional players rotate out of volatile assets like BTC and into perceived safe havens such as Treasury bonds and gold. For Bitcoin, whose narrative often oscillates between “digital gold” and “high-beta tech,” this shift can be particularly painful, especially after a parabolic run-up.
ETF Outflows and Deleveraging
Another key driver of the current BTC price action is the unwinding of leveraged positions and ETF flows: This combination of forced selling and ETF outflows creates a self-reinforcing spiral: lower prices cause liquidations, which push prices further down, which then spook more investors watching Bitcoin news today for clues on where the pain will stop. Analysts tracking on-chain data have observed rising Bitcoin inflows to exchanges, a classic sign that holders may be preparing to sell. At the same time, spot buying has struggled to absorb the selling pressure, especially near key support levels below $90,000 and around $82,000. When more BTC moves onto exchanges than off, it usually reflects short-term bearishness and can weigh heavily on price until a new group of buyers steps in. BTC Price Slides.
Support Around $90K and $82K
As of late November, Bitcoin has broken below the psychologically important $90,000 barrier, which once acted as a strong support zone. Analysts now point to two key levels in the short term:If BTC can stabilize and form a base in this band, it would strengthen the argument that Bitcoin news today is documenting a large but ultimately healthy correction rather than the start of a prolonged bear market. One of the most talked-about patterns in recent BTC price analysis is the looming or recently triggered death cross, where the 50-day moving average falls below the 200-day moving average. Traditionally, this is seen as a bearish signal indicating weakening short-term momentum.
However, historical data shows that for Bitcoin, death crosses have often coincided with or slightly lagged local bottoms rather than marking the start of more downside. In the current cycle, multiple studies have noted that prior death crosses in 2023–2025 actually aligned with major low points, after which BTC eventually rallied. That’s why some analysts view the current death cross not just as a warning, but also as a potential sign that the worst of the BTC price crash may already be behind us. BTC Price Slides.
Long-Term Moving Averages and VWAP
Beyond the death cross, traders are monitoring longer-term support zones such as the 50-week simple moving average, which currently sits a bit above $100,000 and has historically acted as a “bull market line in the sand.” Bitcoin has also been trading near its yearly volume-weighted average price (VWAP), an area where prior cycles have seen large players accumulate positions. Recent Bitcoin price analysis suggests that this VWAP region is now functioning as a key pivot zone, with on-chain data hinting at bottom formation as selling pressure eases. If BTC can reclaim and hold these levels in the coming weeks, it would significantly strengthen the bullish case.
MVRV Entering Historic “Buy Zone”
One of the most referenced metrics in on-chain BTC analysis is the Market Value to Realized Value ratio (MVRV). This indicator compares the current market price to the average cost basis of all coins in circulation. As of early November, MVRV has dipped into zones historically associated with market bottoms, often between 0.8 and 1.0. In previous cycles, whenever MVRV dropped to these levels, it marked periods when the average investor was holding at a loss and selling pressure from long-term holders declined. These phases have historically preceded substantial price recoveries. The fact that MVRV has re-entered this “accumulation range” supports the argument that Bitcoin may be undervalued relative to its realized value and that the market could be forming a new floor. BTC Price Slides.
Backwardation in Futures Markets
Another notable development in Bitcoin news today is the appearance of backwardation in BTC futures markets. Typically, futures prices trade above spot prices (a condition known as contango). When futures trade below spot, it often indicates strong short-term fear and hedging activity. Recent analysis suggests that this shift into backwardation may be signaling a market bottom, as it often reflects panic positioning by short-term players at the very moment when long-term investors begin to accumulate. Historically, periods of deep backwardation have aligned with major lows in volatile assets, including Bitcoin, as the market eventually reverts to a more normalized structure once fear subsides.
Scenarios: From $80K Support to Deeper Drawdowns
Not everyone is convinced the bottom is in. Some technical analysts warn that if BTC fails to hold the $80,000–$82,000 zone, a deeper slide toward the mid-$40,000s cannot be entirely ruled out, especially if macro conditions worsen and ETF outflows continue. Others emphasize that even in strong bull markets, 30%–50% drawdowns are common for Bitcoin. Corrections of this magnitude have occurred in virtually every major cycle and have often shook out weak hands before a powerful continuation of the uptrend. BTC Price Slides.
Bottoming Phase vs. Immediate Bounce
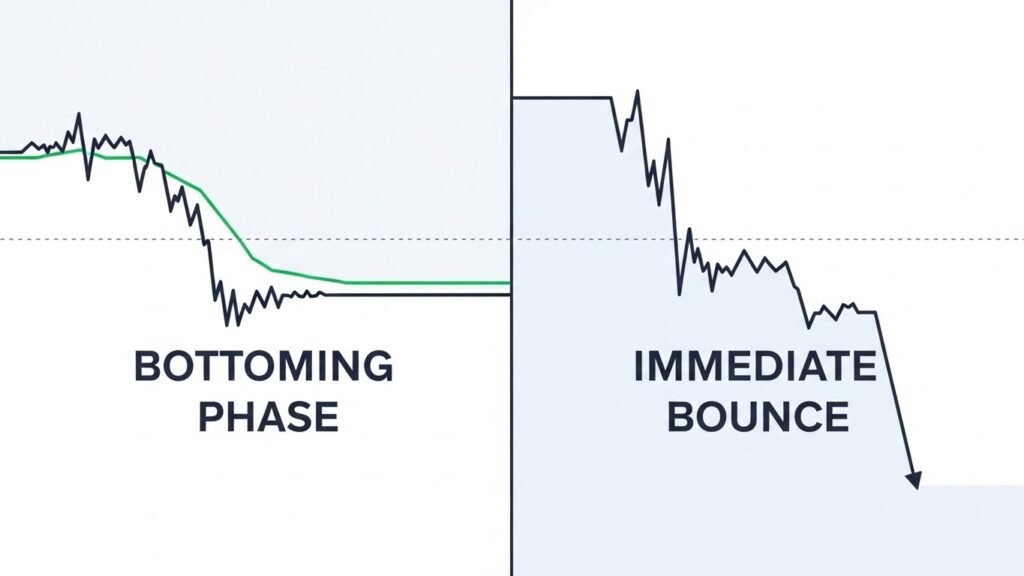
A growing consensus among more cautious bulls is that we may be entering a bottoming phase rather than setting up for an immediate V-shaped reversal. That means the Bitcoin price today could: For patient investors, that type of slow grind can be more constructive than a sudden spike, because it allows for healthier accumulation and a more sustainable base for future rallies. If you are following Bitcoin news today and trying to make sense of the market, it is useful to separate your approach into short-term trading and long-term investing.
Short-Term Traders: Volatility and Risk Management
For active traders, this environment is both exciting and dangerous. Volatility is high, liquidity can be patchy, and the market reacts sharply to new macro or regulatory headlines. In this phase, risk management is everything. Tight stop-losses, position sizing, and avoiding excessive leverage are often more important than trying to perfectly predict the exact bottom.
Long-Term Investors: Accumulation and Patience
For long-term believers in Bitcoin’s digital store of value narrative, the focus is different. Many of the classic bottom indicators—MVRV in the buy zone, backwardation, rising stablecoin reserves, and death crosses near major support—have historically been associated with attractive long-term entry points. That doesn’t mean the price cannot go lower. It does mean that from a historical standpoint, BTC price today looks more like a late-stage correction than the top of a speculative mania. Strategies like dollar-cost averaging, spreading buys over time, and focusing on multi-year horizons often make more sense than trying to nail the exact bottom tick. BTC Price Slides.
Conclusion
The dominant theme in Bitcoin news today is fear, and for good reason. BTC has suffered a fierce drawdown from record highs, ETFs are seeing record outflows, leveraged traders have been wiped out, and macro uncertainty hangs over all risk assets. No one can say with certainty whether the current level is “the” bottom. What we can say is that the ingredients of a bottoming phase are increasingly present. For traders, this is a time for disciplined risk management. For long-term investors, it may be a period to study the data, refine strategy, and consider gradual accumulation rather than panic. In other words, while the BTC price is sliding, the foundations for the next chapter of the cycle may already be quietly forming beneath the fear.
FAQs
Q. Why is Bitcoin price down so much in the latest Bitcoin news today?
Bitcoin’s recent drop is the result of several overlapping factors. Macro uncertainty has pushed investors into a risk-off mode, weighing on volatile assets like cryptocurrencies. At the same time, record ETF outflows, large liquidations of leveraged long positions, and rising exchange inflows have added selling pressure. Together, these forces have driven BTC from highs above $120,000 to the $80,000–$90,000 range in a relatively short time, amplifying fear and volatility across the crypto market.
Q. Are analysts really seeing bottom signals for BTC?
Yes, many analysts point to a cluster of bottom signals showing up at once. The MVRV ratio has entered zones historically associated with market lows, suggesting that a large share of holders are underwater and less likely to sell aggressively. Futures markets have slipped into backwardation, reflecting fear and hedging, while some on-chain metrics show selling pressure easing and stablecoin buying power increasing. These conditions do not guarantee an immediate rebound, but they often appear near important BTC cycle lows.
Q. What is a death cross, and what does it mean for Bitcoin news today?
A death cross occurs when the 50-day moving average of an asset’s price falls below the 200-day moving average. In traditional technical analysis, it is seen as a bearish sign that confirms a downtrend. For Bitcoin, however, historical data suggests that death crosses often occur after most of the damage has already been done and can coincide with local bottoms rather than major tops. In the current cycle, the approaching or confirmed death cross near key support has added to the fear in the headlines, but some analysts interpret it as a lagging indicator that might actually mark the late stages of the current correction.
Q. Could Bitcoin still fall much lower from the current price?
It is possible. Some technical analysts warn that if Bitcoin fails to hold support levels around $80,000–$82,000 and broader macro conditions deteriorate further, we could see deeper drawdowns, with some models highlighting the potential for a move toward the mid-$40,000s in a worst-case scenario. That said, many experts believe that the current zone, combined with the on-chain bottom signals, makes an extended slide less likely unless there is a severe external shock. Investors following Bitcoin news today should therefore be prepared for volatility in both directions while recognizing that extreme scenarios, while possible, are not guaranteed.
Q. How should long-term investors respond to the current BTC price drop?
Long-term investors often view sharp corrections like this as part of Bitcoin’s normal cycle rather than as a reason to abandon their thesis. Historically, large drawdowns during bull markets have often preceded strong recoveries. For those with a multi-year outlook, strategies such as dollar-cost averaging, diversifying across assets, and focusing on fundamentals may make more sense than trying to trade every move. The presence of on-chain accumulation signals, backwardation, and ETF rebalancing suggests that we may be closer to a bottoming phase than to the top, though there are no guarantees. The key is to align any decision with one’s risk tolerance, time horizon and overall financial plan, rather than reacting solely to the fear in Bitcoin news today.
See more;Bitcoin News: Bitcoin Drops Below $95K as AI Market Crash and ETF Outflows Hit Crypto Sentiment