Bitcoin at $92K: Will BTC Dodge Another Big Crash?
BTC price stalls near $92K as traders fear a sharp correction. Discover key support levels, on-chain signals, and macro trends shaping Bitcoin’s next move.

Bitcoin, hovering around the $92,000 mark, is exactly the kind of moment that makes crypto traders nervous. After such a huge rally, many investors start asking the same question: is this another local top before a brutal crash, or just a healthy pause before the next leg up? The BTC price has a long history of explosive bull runs followed by painful drawdowns. Every time Bitcoin enters price discovery near new all-time highs, emotions spike, leverage surges, and social media fills with bold predictions. Some call for $150K or even $250K, while others warn that the market is dangerously overheated and a 40%–60% correction is just around the corner.
With Bitcoin trading around $92K, the stakes feel higher than ever. This level sits in what many analysts see as a psychological zone where early bulls start taking profits and latecomers rush in, fearing they might miss the last big move. At the same time, institutional buyers, ETFs, and long-term holders add a new layer of demand and potential support if the BTC price starts to dip. In this article, we will explore whether Bitcoin can avoid another major crash from the $92K region. We will look at key technical levels, market sentiment, on-chain metrics, derivatives positioning, and macro trends. We will also break down what traders and long-term investors can watch to separate normal volatility from the first signs of a deeper market reversal.
Why the $92K level matters for BTC
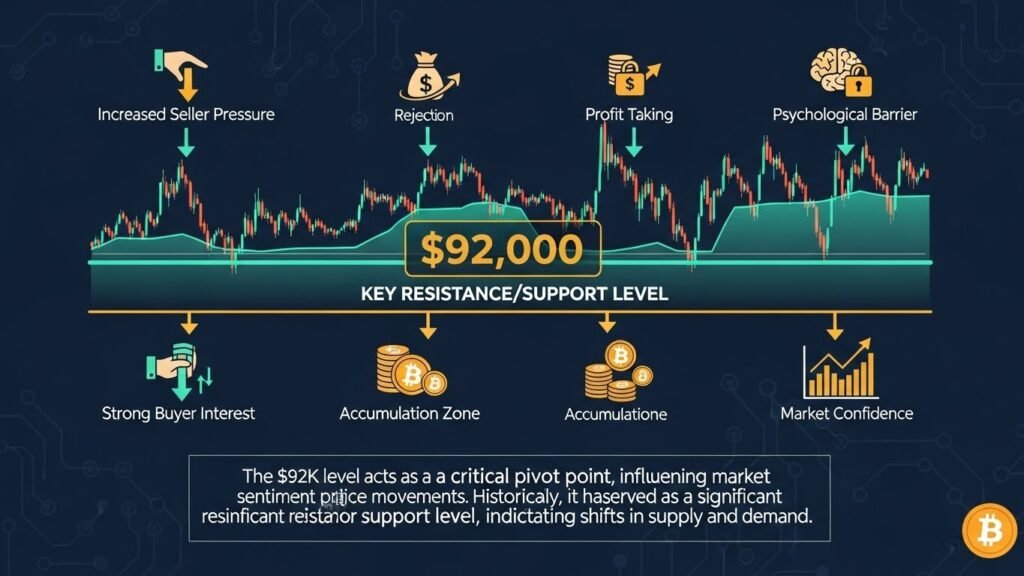
The Bitcoin price at $92K isn’t just a random number on the chart. Psychologically, $90K and $100K are huge round numbers that attract attention far beyond the crypto world. When BTC approaches or consolidates near such levels, liquidity clusters, headlines multiply, and volatility tends to increase.
From a market structure perspective, $92K often acts as a mid-zone between a previous breakout and a potential final blow-off top. If the BTC price rallied rapidly from a lower range, such as the $70K–$80K zone, without many pauses, a consolidation around $92K can be the first real test of buyer strength. Bulls want to see this area transform from short-term resistance into a stable platform for a future move toward six-figure territory. At the same time, many traders who bought Bitcoin in earlier phases of the bull run see $92K as a tempting exit point. They may have set profit targets near $90K or just below $100K months ago. As price stalls in this area, selling pressure and profit-taking can increase. If buyers cannot absorb that supply, the BTC price can “roll over,” starting a correction that may quickly deepen into a sharp crash.
Is Bitcoin overbought at $92K?
One of the first questions serious traders ask is whether Bitcoin is overbought at its current level. Overbought does not mean a guaranteed crash, but it does suggest that upside might be limited if price has run far ahead of its fundamentals and underlying demand. On the technical side, oscillators such as the Relative Strength Index (RSI) or Stochastic indicators often enter overbought territory during strong BTC rallies. That alone is not unusual. Historically, during the strongest phases of a Bitcoin bull market, the BTC price can stay overbought for weeks while continuing to grind higher. However, when these indicators start showing bearish divergence—for example, price makes a new high while RSI prints a lower high—it can signal weakening momentum and rising risk.
Another way to think about overbought conditions is to compare the BTC price to its long-term moving averages, such as the 200-day or 200-week MA. When Bitcoin stretches far above these baselines, corrections become more likely as the market hunts for mean reversion. At $92K, if BTC is trading at multiples of its long-term average, traders may anticipate a pullback to “cool off” the market and shake out speculative excess. The key point is that even if BTC is technically overbought, it does not automatically mean an immediate crash. It simply tells us the margin for error is smaller and the market is more sensitive to negative news, regulatory shocks, or sudden profit-taking.
Lessons from past Bitcoin crashes
To understand whether Bitcoin can avoid another crash from the $92K level, it helps to look back at previous bull markets and their tops. History never repeats perfectly, but it often rhymes. In prior cycles, the BTC price experienced dramatic blow-off tops after parabolic rallies. These phases are marked by vertical price movement, euphoric sentiment, overloaded leverage, and a flood of new retail traders entering late. When the uptrend finally breaks, forced liquidations and panic selling amplify the downturn.
For example, in multiple cycles, Bitcoin has suffered drawdowns of 50%–80% from its all-time highs. These crashes typically unfolded after a combination of factors: At the same time, after every major crash, BTC eventually recovered and went on to set new all-time highs in later cycles. Long-term investors who managed risk and avoided panic tended to benefit from volatility, while overleveraged traders and those buying at the very top often suffered the most. The big question today is whether the presence of institutional demand, spot Bitcoin ETFs, and more mature market infrastructure can soften future crashes—or whether human psychology and speculative excess will continue to drive similar boom-and-bust patterns.
Key support and resistance levels around $92K
Above $92K, the most obvious psychological resistance is $100K. This level is not just important for chartists; it carries enormous symbolic weight for the broader market. Many analysts expect intense volatility if BTC approaches six figures, with aggressive selling from profit-takers and strong buying from investors who see the milestone as validation of Bitcoin’s long-term value. Within the $90K–$100K range, local resistance levels often form based on previous intraday highs, order book clusters, and options strike concentrations. For example, if traders have piled into call options with strikes at $95K and $100K, those levels can act as magnets in the short term, and then as zones of increased hedging and volatility.
On the downside, immediate support might sit in the $85K–$88K region if that zone served as a prior breakout level or saw heavy accumulation on the way up. If BTC loses that range with high volume, price could revisit deeper supports such as the mid-$70Ks or even lower, depending on how extended the prior move was. For Bitcoin to avoid a crash, the key is not just holding one specific number. It is about forming a strong, layered support structure beneath $92K, where dips are repeatedly bought and selling pressure is absorbed without sparking cascading liquidations.
Market sentiment: Euphoria or cautious optimism?
Sentiment is one of the most powerful forces driving the BTC price. When Bitcoin consolidates near $92K, measuring sentiment helps traders gauge whether we are closer to a euphoric blow-off top or a more controlled, sustainable advance. If social media feeds, mainstream headlines, and search trends are dominated by bold predictions of “Bitcoin to $250K” or “BTC will never drop below $100K again,” that kind of language often signals overheating. Newcomers rushing in with little understanding of risk, along with celebrities and influencers promoting altcoins and memes, are classic signs of late-stage mania.
On the other hand, if sentiment is bullish but still mixed—where many analysts openly discuss correction risks, funding rates, and long-term valuation models—the market may be in a healthier state. In this environment, Bitcoin can grind higher from $92K without the same level of froth that usually precedes a crash. Tools such as crypto fear & greed indices, social volume metrics, and trend analysis on related Bitcoin phrases can provide extra confirmation. When sentiment indicators push into extreme greed, traders often become more cautious, especially when BTC is sitting at or near a big milestone like $92K.
On-chain data: Are long-term holders taking profits?
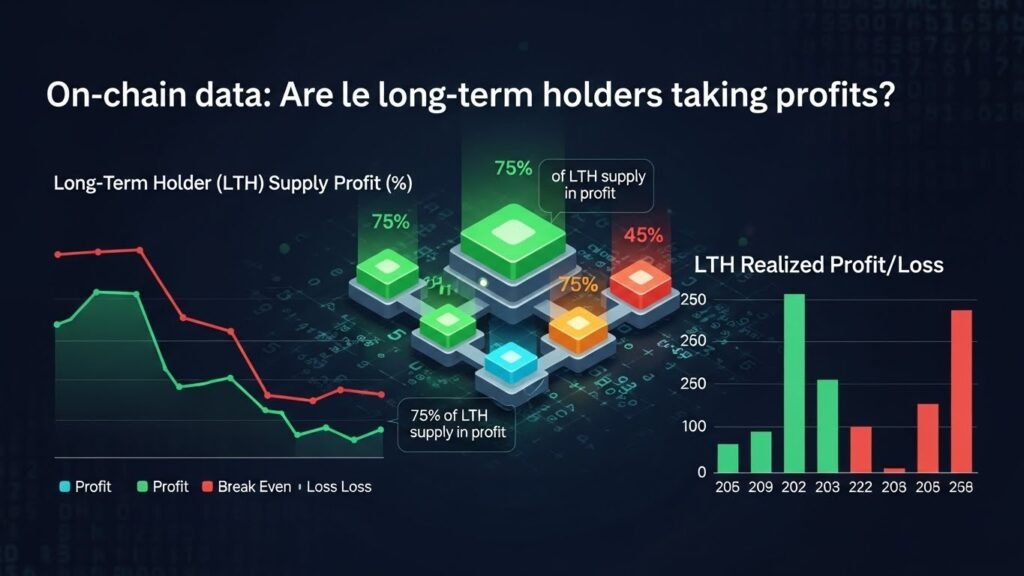
One of the advantages of Bitcoin compared to traditional markets is on-chain transparency. Every transaction is recorded on the blockchain, allowing analysts to track the behavior of different cohorts, such as long-term holders and short-term speculators. When the BTC price pauses at $92K, on-chain data becomes a powerful tool for detecting risk. If long-term holders—addresses that have held coins for months or years—begin to increase their spending, it can indicate that they see current prices as attractive for taking profits. Heavy distribution from these “smart money” players has historically aligned with local tops in the BTC market.
Metrics such as Realized Price, MVRV (Market Value to Realized Value), and HODL waves help highlight whether Bitcoin is entering zones that historically precede major corrections. If MVRV ratios are extremely elevated, it suggests that a large portion of the market is sitting on unrealized profits, creating potential fuel for a sell-off if sentiment shifts. Conversely, if on-chain data shows that long-term holders are mostly sitting tight while short-term traders are more active, corrections from $92K may be shallower. Strong HODLer conviction often acts as a buffer against full-scale crashes, as these investors tend to buy dips instead of panic selling.
Derivatives and leverage: The hidden crash trigger
Even if spot demand for Bitcoin looks healthy, the derivatives market can quietly set the stage for a sudden crash. Futures contracts, perpetual swaps, and options are all crucial components of today’s BTC trading environment, and they can dramatically amplify both upside and downside moves. When BTC is hovering around $92K, traders pay special attention to open interest levels, funding rates, and liquidation clusters. If open interest in BTC futures is extremely high and funding rates are strongly positive, it means many traders are using leverage to bet on further upside. In such a scenario, a relatively small drop in the BTC price can trigger forced liquidations of long positions, which adds selling pressure and pushes price down even further.
This cascade effect can turn a gentle correction into a sharp, fast crash. The good news is that if exchanges and traders manage leverage more conservatively—through lower maximum leverage, dynamic margin requirements, and better risk controls—the market may be able to absorb volatility without spiraling into a meltdown. Monitoring derivatives data around $92K helps distinguish between a stable consolidation and a market sitting on a powder keg of excessive leverage. If leverage starts to reset, with open interest dropping and funding normalizing while BTC holds above key supports, the risk of a destructive crash usually declines.
Macro environment: The bigger picture for BTC at $92K
Bitcoin does not trade in a vacuum. The broader macro environment—including interest rates, inflation expectations, the strength of the U.S. dollar, and global risk sentiment—plays a major role in how the BTC price behaves around major milestones like $92K. In periods when central banks keep interest rates low or signal future cuts, investors often seek alternative assets and risk-on opportunities. Bitcoin, seen by many as “digital gold” with a fixed supply, tends to benefit from this environment. Capital flows into equities, tech, and crypto can support higher BTC prices and soften corrections as dips are quickly bought.
By contrast, if inflation is falling and central banks maintain or even raise interest rates, traditional fixed-income assets may become more attractive. In such a climate, risk assets—including Bitcoin—may face headwinds. A sudden shift in macro expectations, triggered by economic data or geopolitical events, can spark sell-offs even when crypto-specific fundamentals look strong. For BTC at $92K, sustained bullish momentum is easier to maintain if global liquidity conditions are favorable and risk appetite remains healthy. If macro conditions tighten, the market may be more vulnerable to a larger correction, even in the absence of Bitcoin-specific bad news.
Spot ETFs and institutional demand: A new backstop?
One major difference between earlier Bitcoin cycles and the current environment is the presence of spot Bitcoin ETFs and growing institutional participation. These vehicles allow traditional investors to gain exposure to the BTC price through regulated channels, often within retirement accounts or institutional portfolios.
When BTC hovers around $92K, strong ETF inflows can act as a form of support. If dips trigger buy-the-dip behavior from institutional allocators who see Bitcoin as a long-term strategic asset, corrections may be less violent. Regular inflows can absorb some of the selling from traders and short-term speculators. However, ETFs can also amplify downside if sentiment turns broadly negative. If investors start redeeming shares and ETF issuers are forced to sell BTC into a falling market, it can add to selling pressure. The net impact of institutional demand depends on whether these players behave more like long-term HODLers or short-term momentum traders. At $92K, watching ETF flow data, institutional commentary, and fund positioning helps answer a key question: is Bitcoin becoming a more mature, stable asset, or is it still dominated by speculative cycles that can end in dramatic crashes?
Can Bitcoin actually avoid another crash from $92K?
So, with all these factors in play, can Bitcoin avoid another crash while the BTC price consolidates around $92K? The honest answer is that no one can predict the future with certainty—but we can identify conditions that make a crash more or less likely. In other words, whether Bitcoin can avoid another crash is not just about the number $92,000 itself. It’s about how the market behaves around this level, how prepared traders are for volatility, and how disciplined both retail and institutional participants remain as BTC flirts with six-figure territory.
Risk management tips for traders and investors at $92K
Regardless of whether Bitcoin crashes or continues higher from $92K, the most important thing for traders and investors is risk management. The BTC price can move rapidly in both directions, and emotional decisions during volatile periods often lead to losses. Having a plan before volatility hits is crucial. Short-term traders can define clear entry and exit levels, use appropriate position sizing, and avoid excessive leverage that could lead to forced liquidations. Long-term investors can decide in advance which levels they would be comfortable buying more or trimming their positions, based on their time horizon and risk tolerance. Diversification also matters. While Bitcoin can be a powerful growth asset in a portfolio, concentrating too heavily in a single volatile asset can be dangerous. Combining BTC with other assets, both within and outside crypto, can help smooth returns and reduce the emotional impact of sharp price swings.
Conclusion
The BTC price pausing at $92K marks a critical moment in Bitcoin’s ongoing story. It is a level loaded with psychological, technical, and narrative importance. Some see it as the last stop before BTC smashes through $100K and beyond. Others fear it is the calm before yet another storm. While no one can guarantee that Bitcoin will avoid another crash, traders and investors are not powerless. By watching key support zones, on-chain signals, derivatives data, ETF flows, and macro trends, market participants can make more informed decisions and adjust their risk accordingly.
Bitcoin has survived every previous crash and gone on to set new all-time highs. Whether it does so again after consolidating around $92K depends not just on hype, but on the underlying strength of demand, the maturity of market infrastructure, and the discipline of those who choose to participate. For now, $92K is not the final word on Bitcoin—it is the latest chapter in a volatile, evolving market that continues to challenge and reward those willing to understand its rhythms.
FAQs
Q. Why is the BTC price pausing at $92K instead of breaking $100K?
The BTC price often stalls near major psychological levels like $90K or $100K because these zones attract heavy profit-taking and cautious buying.
Q. Does a pause at $92K mean a Bitcoin crash is imminent?
Not necessarily. A pause at $92K can be part of a healthy consolidation where the market digests recent gains before moving higher. A crash becomes more likely if the pause is accompanied by extreme leverage, euphoric sentiment, and heavy distribution from long-term holders.
Q. What indicators should I watch to judge crash risk at $92K?
Key indicators include on-chain metrics like MVRV and long-term holder spending, derivatives data such as funding rates and open interest, and sentiment measures like fear & greed indices or social volume.
Q. How can long-term investors handle volatility around $92K?
Long-term investors can handle volatility by defining their time horizon and allocation strategy in advance. Instead of reacting emotionally to short-term swings, they can use dollar-cost averaging, avoid leverage, and periodically rebalance their portfolios.
Q. Is it still a good time to buy Bitcoin when it’s around $92K?
Whether it is a good time to buy Bitcoin at $92K depends on your risk tolerance, investment horizon, and overall financial situation. Buying near all-time highs always carries the risk of short-term drawdowns.