
Zcash (ZEC) Trading Analysis: Momentum, Key Support, and Breakout Levels
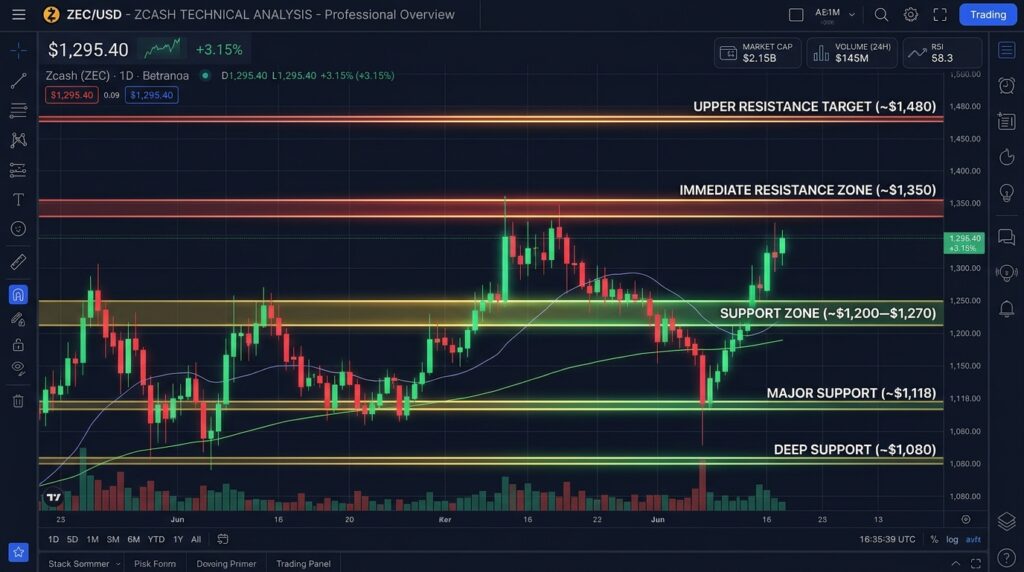
Zcash trading analysis chart showing ZEC support and breakout levels


This Zcash trading analysis breaks down where ZEC stands after a powerful 2026 rally and which price zones matter most next. Zcash climbed from roughly $220 earlier this year to around $1,300 in early November 2026, and that move changed how traders view privacy coins. Momentum, support, and resistance now decide every entry and exit. Read on to see the key levels, the trade setups, and the risks that deserve your attention before you place an order.
Zcash Trading Analysis: Where ZEC Stands Today
Zcash now ranks among the ten largest cryptocurrencies by market capitalization, and its value sits above $20 billion. Buyers pushed the coin far beyond its November 2025 peak near $748, a level many traders once treated as a ceiling. That breakout reshaped the chart and lifted every important level. This section covers the current price, the market backdrop, and the reasons traders keep ZEC on their watchlists.
Current Price Snapshot
Recent exchange data shows ZEC near $1,300, with a 24-hour range between roughly $1,270 and $1,347. Daily trading volume hovers close to $970 million, which signals deep liquidity for a privacy coin. The circulating supply stands near 17 million coins out of a 21 million cap. These figures give any Zcash trading analysis a clear baseline, but prices move fast, so check a live chart before every trade you take.
Why Traders Watch Zcash Now
Several forces keep attention on ZEC. Institutional players entered the ecosystem, developers raised fresh funding, and staking now locks part of the supply away from the market. Privacy also gained appeal as users look for tools that protect their financial data. Each factor adds a layer of demand. Together, they explain why volume stays strong after sharp pullbacks, and why this Zcash trading analysis focuses on structure rather than hype.
Momentum Signals Behind the Zcash Rally
Momentum tells traders whether buyers still control the market. On the daily chart, Zcash points upward, while shorter timeframes show frequent pauses. Those pauses look healthy after such a large advance. This part of our Zcash trading analysis examines trend structure, volume, and sentiment, so you can judge whether the rally still has fuel or needs time to cool down before the next leg higher.
Daily Trend Structure
The daily chart shows higher lows since the spring recovery, and price now holds above the 50-day exponential moving average near $1,205. Buyers defend dips quickly, which keeps the bullish structure intact. A daily close below that average would weaken the case and invite deeper tests. Until that happens, the trend favors patient long positions over aggressive short trades, especially when volume supports each push higher.
Volume and Participation
Volume confirms conviction. When ZEC rises on expanding volume, breakouts tend to hold, and when it rises on thin volume, reversals often follow. Daily turnover near $1 billion shows that real participants trade this coin, not just a handful of wallets. Watch for volume spikes at support and resistance, because those spikes reveal exactly where large buyers and sellers decide to step in.
Sentiment and Market Context
Zcash never trades in isolation. Bitcoin sets the mood for the entire market, so ZEC traders should track it closely. Our report, Bitcoin: The Calm Before the Storm,m explains how options traders price large swings, and the same caution applies here. When Bitcoin turns volatile, privacy coins often move faster in both directions, so size your positions with that extra swing in mind.
Key Support Zones in Zcash Trading Analysis
Support marks the areas where buyers have repeatedly stepped in. Strong support helps traders place stops, plan entries, and measure risk before they commit capital. Zcash currently shows three layers of support, ranging from nearby dips to deeper structural floors. The next sections explain each layer and show how a trader can use it without chasing price.
First Support Near $1,200
The first support cluster sits between $1,200 and $1,270, where the 50-day average and recent consolidation overlap. Buyers often defend this band during routine pullbacks. A bounce here with rising volume offers a low-risk long entry. A clean break below it, however, tells traders to step aside and wait for the next floor to prove itself before they buy again.
Major Floor Around $1,118
The $1,118 level acts as the main floor because buyers lifted price from that low during the latest pullback. Many analysts mark it as the line between a healthy correction and a trend change. Traders who buy near this level can place tight stops just beneath it. A daily close below $1,118 shifts the balance toward sellers and calls for caution.
Deep Support at $1,080
The $1,080 area forms the bottom of the channel that several analysts track for November. If ZEC falls this far, the market likely flushes out leveraged longs and resets. Long-term buyers often accumulate here, but short-term traders should wait for stabilization first. A rebound from this zone with strong volume would confirm that the bulls still hold control of the trend.
Zcash Trading Analysis of Breakout Levels Above $1,350
Breakouts reward patience when traders confirm them properly. Zcash faces a ladder of resistance above current prices, and each rung offers a different trade. This part of the analysis maps the key zones and explains how to separate genuine breakouts from false moves that trap eager buyers and drain accounts within a single session.
Immediate Resistance at $1,350
The $1,347 high from the last 24 hours and the $1,350 round number form the first barrier. Sellers defended this zone before, so price often stalls here. A strong daily close above $1,350 signals fresh buying interest. Traders can then target the next resistance while they trail their stops beneath the breakout candle to protect gains if the move fails.
Upper Target Near $1,480
The $1,480 level caps the channel that analysts expect for November. Reaching it would deliver roughly a 12 percent gain from current prices. Traders should take partial profits there, because resistance often triggers sharp reversals. A decisive close above $1,480 would open the door to fresh highs and attract a new wave of momentum buyers who currently wait on the sidelines.
How to Confirm a Real Breakout
A real breakout needs three things: a daily close above resistance, volume well above average, and a successful retest of the broken level. Without all three, treat the move with suspicion. Fakeouts trap eager buyers and fuel quick reversals. Wait for confirmation, accept a slightly worse entry price, and enjoy a much higher win rate over many trades instead of chasing every spike.
Zcash Trade Setups for Swing Traders
Levels become useful only when they turn into a plan. Swing traders can turn this Zcash trading analysis into two clean setups, one for breakouts and one for pullbacks. Each setup needs a defined entry, stop, and target. Treat the following examples as frameworks that you adapt to your own risk tolerance, not as financial advice.
Breakout Entry Setup
Enter long after ZEC closes above $1,350 on strong volume and then retests that level. Place your stop below the retest low, and aim for $1,480 as the first target. This setup keeps risk small and rewards trend continuation. Skip the trade if volume fades or if Bitcoin drops sharply while the breakout unfolds, because weak conditions raise the odds of a failure.
Pullback Entry Setup
Buy the dip when ZEC revisits the $1,200 to $1,270 zone and prints a bullish reversal candle. Set your stop beneath $1,118 to avoid noise, and target $1,350 first. This approach offers a better risk-to-reward ratio than chasing breakouts. Read our crypto trading and market update for late October 2026 for broader context before you commit.
Risk Management Rules
Risk only 1 to 2 percent of your account on any single ZEC trade. Size each position by the distance between entry and stop, not by excitement. Avoid heavy leverage, because Zcash can swing more than 10 percent in a single day. Our Polkadot trading strategy guide applies the same discipline to another altcoin, and its lessons carry over directly.
Catalysts and Risks Behind Zcash Price Action
Technical levels explain where price may turn, while fundamentals explain why it turns. Zcash faces both supportive catalysts and real risks. Understanding them helps you decide how large a position to hold and how long to hold it. The next two sections cover the upside drivers first, and then they examine the threats that could break the trend.
NU7 Upgrade and Privacy Demand
The upcoming NU7 network upgrade gives traders a near-term catalyst to watch. Upgrades often build anticipation, and privacy features attract users who want financial confidentiality. You can follow development news on the official Zcash website and compare it with price action on the TradingView ZEC chart. Positive news paired with a support bounce creates the strongest setups.

Risks Every Trader Should Respect
Regulation remains the largest risk for privacy coins, because exchanges can delist assets under pressure. Leadership changes, such as the January 2026 departure of the Electric Coin Company team, also add uncertainty. Finally, a high price means a large drawdown can arrive fast. Read the CoinMarketCap AI analysis for Zcash for another viewpoint, and never invest more than you can afford to lose.
Frequently Asked Questions About Zcash Trading Analysis
Traders often ask the same questions before they open a ZEC position. The answers below address the most common concerns about suitability, support, breakouts, and risk. Use them as a quick reference while you plan your next trade, and remember that every market condition changes, so review the live chart again before you act on any level.
Is Zcash a good coin for short-term trading?
Zcash suits short-term trading because it offers high liquidity and wide daily ranges. Those ranges create opportunities, but they also raise risk. Traders who use defined stops and modest position sizes manage the volatility best. Beginners should practice with small amounts first, and they should never risk money that they cannot afford to lose in a fast market.
What is the most important Zcash support level?
Most analysts watch $1,118 as the main floor, because buyers defended it during the latest pullback. The $1,200 to $1,270 band offers earlier support, while $1,080 marks deeper protection. A daily close below $1,118 would weaken the bullish case, so traders often place stops just under that level and reduce their size when price approaches it.
Which level confirms a Zcash breakout?
A daily close above $1,350 on strong volume starts the breakout case, and a successful retest of that level confirms it. The next target then sits near $1,480. Traders who skip the retest often face fakeouts. Patience costs a little entry price, but it protects capital and improves the overall quality of every trade you take.
What risks should Zcash traders watch?
Regulatory pressure, exchange delistings, leadership changes, and sudden volatility rank as the biggest risks. Bitcoin weakness can also drag ZEC lower, even when Zcash news stays positive. Traders reduce these risks by using stop-losses, limiting leverage, and sizing positions carefully. Diversifying across several assets adds another layer of protection against a single coin falling sharply.
Final Thoughts on Zcash Trading Analysis
This Zcash trading analysis shows a coin with strong momentum, deep liquidity, and clear technical levels. Support near $1,200, $1,118, and $1,080 protects the downside, while resistance at $1,350 and $1,480 defines the upside. Wait for confirmation, manage risk, and track Bitcoin and upgrade news. Disciplined traders can use these zones to plan entries, but no analysis guarantees profit, so always do your own research.