
Polkadot (DOT) Trading Strategy: Key Levels, Trends, and Entry Points
Learn how to read DOT charts, mark support and resistance, time your entries, and manage risk with a simple step-by-step plan.


A solid Polkadot trading strategy helps you trade DOT with a plan instead of emotion. Many traders buy DOT after a sharp pump, then panic when the price drops. You can avoid that mistake when you study key levels, read the trend, and pick entry points with care. This guide walks you through each step in plain language. You will learn how to mark support and resistance, how moving averages and momentum tools guide your timing, and how to protect your capital. Read the full guide, then test every idea on a demo account first. For more market education, explore Crypto L7.
Why Market Structure Shapes Every Polkadot Trading Strategy
Every Polkadot trading strategy starts with market structure. Market structure describes how price moves through a series of highs and lows. When DOT makes higher highs and higher lows, buyers control the market. When it makes lower highs and lower lows, sellers take over. Traders who ignore this basic pattern often fight the trend and lose money. Start by opening a daily chart on a platform such as TradingView, and zoom out far enough to see the last several months. Mark the major swing highs and swing lows, and note where price reversed more than once. These zones give you the foundation for every decision that follows.
Understanding Polkadot and the DOT Token
Polkadot is a multichain network that connects separate blockchains so they can share data and security. Gavin Wood, a co-founder of Ethereum, created the project, and the network launched in 2020. DOT is the native token, and holders use it for staking, governance, and securing parachains. Developers build specialized chains on Polkadot, and these chains plug into a shared security layer. Network upgrades, developer activity, and ecosystem news often move the DOT price. Traders who understand these drivers react faster to headlines and avoid surprise moves. Visit the official Polkadot website to follow the latest network updates and roadmap news.
How to Identify Key Support and Resistance Levels
Support is a price zone where buyers repeatedly step in and stop a decline. Resistance is a zone where sellers repeatedly push price back down. Draw horizontal zones, not thin lines, because DOT rarely reverses at one exact price. Look for areas where price reversed at least two or three times. Round numbers also attract orders, so watch them closely. When price breaks above resistance and holds, that old resistance often turns into new support. The same logic works in reverse for broken support. Use the weekly chart for major zones and the four-hour chart for fine-tuning, and always check the volume at each level to confirm its strength.
Reading DOT Trends with Moving Averages
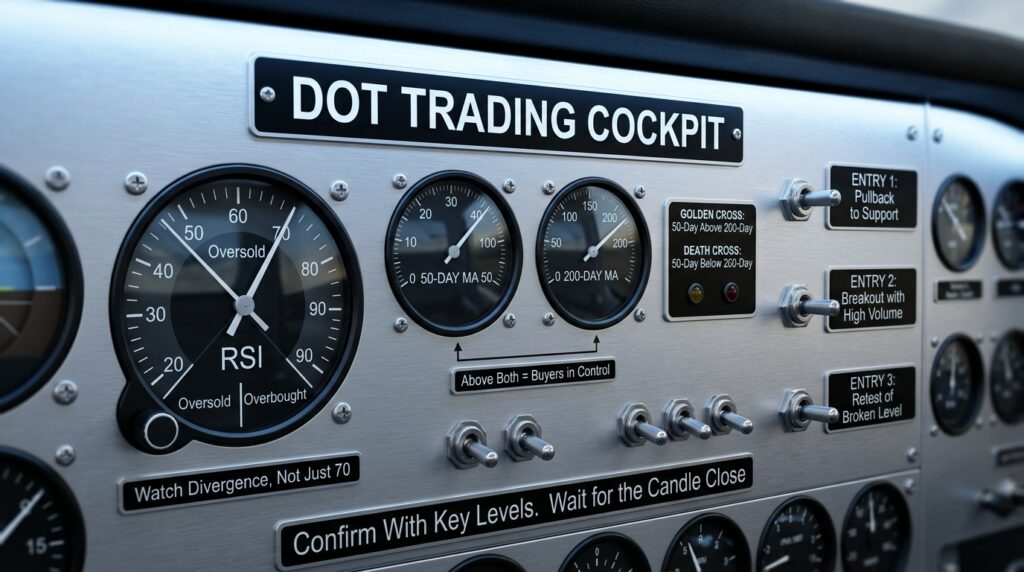
Moving averages smooth out price noise and show the direction of the trend. Many traders watch the 50-day and 200-day moving averages on DOT. When price trades above both lines, the trend favors buyers. When price trades below both, the trend favors sellers. A golden cross happens when the 50-day line crosses above the 200-day line, and traders often treat it as a bullish signal. A death cross happens in the opposite direction. Remember that moving averages lag behind price, so they confirm a trend rather than predict one. Combine them with your key levels to avoid false signals during sideways markets.
Using Momentum Indicators for Better Timing
Momentum indicators help you judge whether a move has strength or runs out of steam. The Relative Strength Index, or RSI, measures speed on a scale from zero to 100. Readings above 70 suggest overbought conditions, and readings below 30 suggest oversold conditions. In strong trends, however, RSI can stay extreme for a long time, so do not sell just because it crosses 70. Watch for divergence instead. When price makes a new high but RSI makes a lower high, buying pressure weakens. The MACD indicator adds another view by comparing two moving averages. Use these tools as confirmation, never as your only reason to enter a trade.
Smart Entry Points for Your Polkadot Trading Strategy
A good entry point gives you a clear reason to buy and a clear place to be wrong. Many traders use three entry styles. The first style buys a pullback to support inside an uptrend. The second style buys a breakout above resistance after a strong candle close with high volume. The third style buys a retest, where price breaks out, returns to the broken level, and bounces. Wait for the candle to close before you act, because intraday wicks often fool impatient traders. Place your entry order near the level, not far above it, so your risk stays small. Patience gives you better prices than chasing green candles.
Risk Management Rules Every DOT Trader Needs
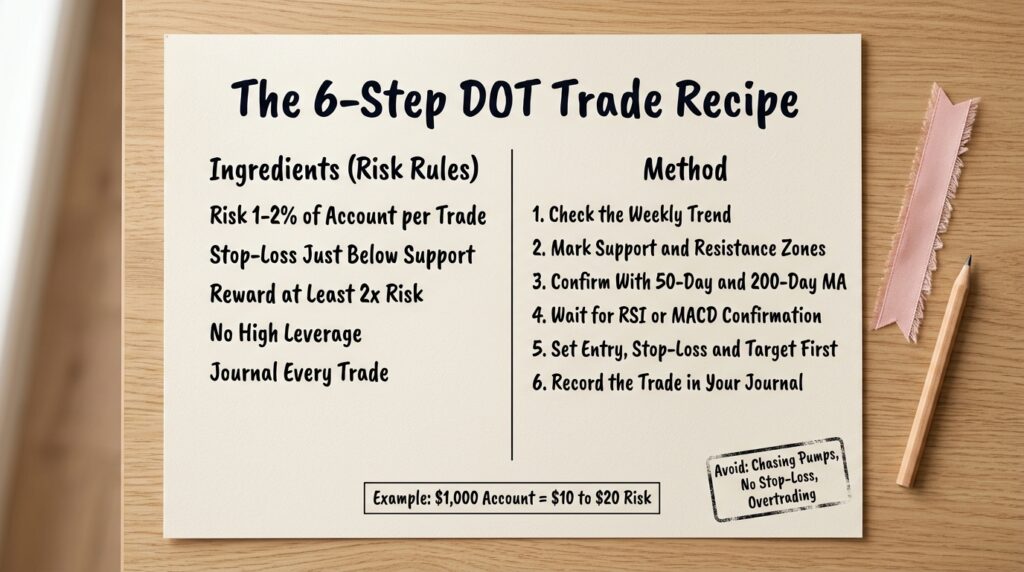
Risk management keeps you in the game when trades go wrong. Risk only one to two percent of your account on a single trade. Place your stop-loss just below support for long trades, so a real breakdown closes your position quickly. Calculate your position size from the distance between your entry and your stop, not from a gut feeling. Aim for a reward at least twice as large as your risk. Avoid high leverage, because crypto moves fast and leverage can liquidate a small account in minutes. Keep a trading journal and review it weekly. Learn more about protecting your capital in our crypto guides at Crypto L7.
Building a Step-by-Step Polkadot Trading Strategy
You can combine everything above into one simple routine. First, check the weekly chart and decide whether the trend points up, down, or sideways. Second, mark the major support and resistance zones. Third, confirm direction with the 50-day and 200-day moving averages. Fourth, wait for price to reach one of your zones, then look for an RSI or MACD confirmation. Fifth, set your entry, stop-loss, and target before you click the buy button. Sixth, record the trade in your journal. Repeat this process on every setup, and you will build discipline. This Polkadot trading strategy works best when you follow the rules every single time.
Common Mistakes DOT Traders Should Avoid
New traders repeat the same errors, and you can avoid most of them. Many traders chase pumps after a big green candle, and they buy right before a pullback. Others skip the stop-loss and hope the price recovers. Some traders overtrade, opening dozens of positions out of boredom. Many ignore Bitcoin, even though DOT usually follows the broader market when Bitcoin moves sharply. Others trade on social media hype instead of their own analysis. Fix these mistakes by writing your rules down and following them. Review your losing trades honestly, and you will spot patterns that cost you money. Check live DOT data on CoinGecko before every session.
Frequently Asked Questions About DOT Trading
What is the best time frame for DOT trading?
Your time frame depends on your goals. Swing traders usually combine the daily chart for direction with the four-hour chart for entries, and they hold trades for several days or weeks. Day traders prefer the 15-minute and one-hour charts, but they face more noise and higher fees. Beginners should start with the daily and four-hour charts, because slower charts give clearer signals and leave more time to think. Pick one style, test it on a demo account, and stick with it for at least a month.
Can beginners use a Polkadot trading strategy?
Yes, beginners can use a Polkadot trading strategy as long as they keep it simple. Start with support and resistance, one or two moving averages, and strict risk rules. Skip complex indicators until you understand the basics. Practice on a demo account or with very small positions, and record every trade. Most beginners improve quickly when they review their results each week and fix one mistake at a time. Never risk money you cannot afford to lose.
How much should I risk on each DOT trade?
Most traders risk between one and two percent of their account on each trade. For example, if you hold a $1,000 account, you risk $10 to $20 per trade. This rule lets you survive a long losing streak without major damage. Set your stop-loss first, then calculate your position size from it. Never move your stop further away just because a trade goes against you.
Does Bitcoin affect the price of Polkadot?
Yes, Bitcoin strongly influences the entire crypto market, including DOT. When Bitcoin rallies, altcoins like Polkadot often follow, and when Bitcoin drops sharply, DOT usually falls with it. Check the Bitcoin trend before every DOT trade. If Bitcoin looks weak, reduce your position size or wait for a better setup. This habit protects you from surprise moves that ignore DOT’s own chart.
Final Thoughts on Your Polkadot Trading Strategy
A strong Polkadot trading strategy relies on structure, not guesswork. You now know how to read market structure, mark key levels, confirm trends with moving averages, and time entries with momentum tools. You also know how to protect your account with strict risk rules. Start small, test every idea on a demo account, and review your journal often. Markets change, so keep learning and adjust your plan when conditions shift. This article offers education only, not financial advice, so always do your own research. Keep exploring more crypto guides at Crypto L7 to sharpen your skills.