Bitcoin Nears Two-Year Make-or-Break Resistance: What’s Next?
Bitcoin nears its two-year make-or-break resistance level. Discover what analysts are saying and what could happen next for BTC price action.

Bitcoin nears a critical two-year make-or-break resistance zone that analysts say could define the direction of the crypto market for months to come. After an extended period of consolidation and price volatility, BTC is once again challenging a price ceiling that has historically stopped rallies dead in their tracks. Whether Bitcoin can decisively clear this level — or fall back in rejection — will serve as a crucial signal for both short-term traders and long-term investors alike. Understanding what this resistance means, why it matters so much, and what could trigger a breakout or breakdown is essential for anyone with skin in the game.
For more than two years, this price region has acted as a powerful supply wall, attracting sellers every time Bitcoin approaches it. The stakes could not be higher: a clean break above could open the door to a Bitcoin bull run, while a failure to hold could send prices spiraling lower. In this article, we break down the technical picture, the macroeconomic forces at play, and what the most credible analysts are saying about what happens next.
Bitcoin’s Two-Year Make-or-Break Resistance
To understand why the Bitcoin two-year make-or-break resistance carries so much weight, it helps to revisit what happened the last time BTC traded at this level. Back in the previous cycle, this price zone marked the point where aggressive selling pressure overwhelmed buyer demand, triggering one of the sharpest corrections in recent memory. Since then, it has remained a major supply zone — a place where early investors who bought higher are eager to exit, and where short-sellers see an attractive opportunity to enter.
In technical analysis, resistance levels are not arbitrary lines on a chart. They represent concentrations of historical trading activity — price points where a significant number of market participants entered or exited positions. The more times a level has been tested and held, the stronger it becomes, because each test reinforces the memory of that price in the market’s collective psychology. Bitcoin’s current resistance is doubly significant because it hasn’t just been tested once — it has repelled multiple rally attempts over a span of two years.
What makes this moment particularly compelling is the context. Bitcoin has been climbing steadily, accumulating momentum amid renewed institutional interest, improving macroeconomic conditions, and growing retail participation. The approach to this level is happening with more conviction than any of the previous failed attempts, which has sparked genuine debate about whether this time will be different.
Why This Level Has Repeatedly Rejected Bitcoin
Market analysts point to a combination of factors that have made this particular BTC resistance level so durable. First, there is the volume profile: on-chain data shows that a disproportionately large amount of Bitcoin changed hands near this price zone during the previous peak, meaning a large cohort of holders are currently underwater or near breakeven. These holders represent persistent selling pressure — the moment prices recover to their entry point, many will seize the chance to exit.
Second, the 200-week moving average and several long-term trend lines converge near this zone, adding technical gravity to the level. When multiple indicators align at the same price, it creates what analysts call a confluence resistance — a far more formidable barrier than any single indicator alone. Finally, derivatives markets show elevated open interest near this level, suggesting that a large number of leveraged traders are watching and positioned around this price.
The Macro Environment Shaping Bitcoin’s Price Action
No analysis of Bitcoin’s resistance test would be complete without examining the broader macroeconomic environment. Bitcoin does not trade in a vacuum. Its price is increasingly influenced by global liquidity conditions, Federal Reserve policy, institutional flows, and sentiment in traditional risk assets like equities.
In recent months, a shift in the interest rate environment has begun to favor risk-on assets, including cryptocurrencies. When rates fall or when market participants expect them to fall, capital tends to flow out of safe-haven assets and into higher-risk, higher-reward investments. Bitcoin, despite its volatility, has increasingly been treated as a macro asset by institutional players — a digital store of value with upside potential in low-rate environments. This tailwind has contributed directly to BTC’s advance toward its critical resistance.
At the same time, spot Bitcoin ETF inflows have provided fresh demand from a class of investors who previously had limited access to crypto exposure. Since the approval of spot ETFs, billions of dollars have flowed into these vehicles, creating consistent buying pressure that has helped sustain Bitcoin’s uptrend. The question is whether this institutional demand is strong enough to absorb the selling pressure that historically emerges at the make-or-break resistance level.
How Global Liquidity Affects Bitcoin’s Resistance Test
Global liquidity cycles have a well-documented correlation with Bitcoin’s major price moves. Periods of expanding global money supply have historically preceded Bitcoin bull markets, while liquidity contractions have been associated with bear markets. Currently, global M2 money supply — a broad measure of money in circulation — has been expanding, a signal that historically bodes well for Bitcoin price prediction models.
Analysts who track the relationship between global liquidity and BTC market cycles suggest that if the liquidity environment continues to expand, Bitcoin could have the macro fuel it needs to push through its resistance and enter price discovery — a phase where there are no overhead supply zones to contend with because BTC would be trading at all-time highs. This scenario would represent one of the most significant developments in Bitcoin’s history.
What Top Analysts Say About Bitcoin’s Make-or-Break Resistance Level
The Bitcoin two-year make-or-break resistance has become one of the most discussed topics among cryptocurrency analysts, traders, and on-chain researchers. Opinions are divided, but several key themes have emerged from the most credible voices in the space.
On the bullish side, analysts point to the quality of the current advance. Unlike previous failed tests, Bitcoin is approaching this level with higher lows, strong on-chain fundamentals, and significant institutional backing. The exchange reserves of Bitcoin — the amount of BTC held on trading platforms — have been declining for an extended period, indicating that holders are moving coins into cold storage rather than positioning to sell. This behavior is typically associated with long-term conviction, not capitulation.
Bearish analysts, however, caution that resistance levels of this magnitude rarely break on the first real attempt. They point to the concentration of derivative positions near the current price, warning that a failed breakout could trigger a cascade of liquidations that would push Bitcoin sharply lower before any sustainable recovery becomes possible. The battle between these two camps is playing out in real time with every daily candle close.
On-Chain Signals Around the Critical BTC Resistance Zone
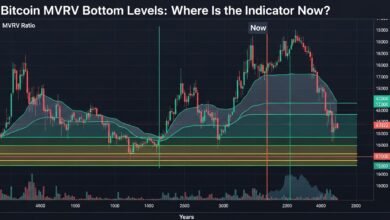
On-chain analysis adds another dimension to the Bitcoin resistance level debate. Key metrics such as the MVRV ratio (Market Value to Realized Value), SOPR (Spent Output Profit Ratio), and the Net Unrealized Profit/Loss all paint a picture of a market that is neither overextended nor in distress. The MVRV ratio, which measures how much profit or loss the average Bitcoin holder is sitting on, is currently at a level that has historically corresponded with mid-cycle conditions — not the euphoric tops that precede major crashes.
The long-term holder cohort — wallets that have held BTC for more than 155 days — has been steadily accumulating rather than distributing, another positive signal. When long-term holders add to their positions, it suggests they believe the current Bitcoin price represents value. Conversely, heavy long-term holder selling near resistance would be a warning sign that the rally is losing steam. Currently, the data leans toward accumulation, supporting the bullish case.
The Two Scenarios: Breakout vs. Breakdown
When Bitcoin faces a make-or-break resistance test of this magnitude, there are really only two meaningful outcomes: a sustained breakout above resistance that confirms a new bullish trend, or a rejection that sends prices back toward support. Understanding the conditions and implications of each scenario is critical for making informed decisions.
Scenario One: Bitcoin Breaks Above Resistance
A decisive Bitcoin breakout above the two-year resistance would carry significant implications.
For a breakout to be considered valid and sustainable, analysts generally look for a weekly close above the resistance level with above-average trading volume. A high-volume close signals genuine conviction from buyers, as opposed to a low-liquidity spike that quickly reverses. If Bitcoin achieves this, the next significant resistance levels are considerably higher, raising the prospect of a major price rally.
Scenario Two: Bitcoin Faces Rejection and Pulls Back
A rejection typically involves a sharp reversal from the resistance level, with prices falling back to the nearest support zone. The severity of the pullback would depend on how overleveraged the market is at the time of rejection and how quickly buy-side liquidity re-enters.
Experienced traders view pullbacks from key resistance levels as potential buying opportunities, particularly if the underlying fundamentals remain intact. A healthy retest of support — where Bitcoin dips to a lower level, finds buyers, and bounces — can actually strengthen the technical picture for a future breakout attempt. The key is whether demand zones hold and whether the broader market environment remains supportive.
What Bitcoin’s Make-or-Break Resistance Means for Investors
For investors, the Bitcoin two-year resistance test is not just a technical event — it is a moment of strategic reckoning. How one responds to this inflection point should depend on individual risk tolerance, investment horizon, and portfolio objectives. What is universally true, however, is that ignoring this level would be a mistake.
Short-term traders may look to reduce exposure ahead of the resistance test and re-enter on a confirmed breakout or a deep pullback to support. Long-term Bitcoin investors with a multi-year horizon may choose to maintain their positions regardless of how the near-term test resolves, trusting in the macro narrative of digital scarcity and growing institutional adoption. Dollar-cost averaging — gradually adding to a position over time rather than making a single large bet — remains one of the most sensible strategies during periods of high uncertainty. The cryptocurrency market is notorious for rapid, violent moves in both directions, and the leverage available on derivatives platforms amplifies both gains and losses. Regardless of which scenario ultimately plays out at this critical Bitcoin resistance level, maintaining appropriate position sizes and having a clear plan for both outcomes is essential.
Historical Parallels: How Bitcoin Has Handled Resistance Before
Looking at Bitcoin’s price history provides valuable context for the current moment. In previous market cycles, Bitcoin has faced similarly daunting resistance levels that appeared impenetrable — until they weren’t. The transition from resistance to support, while rarely linear or immediate, has historically been a feature of Bitcoin’s long-term uptrend.
The 2020–2021 bull cycle, for example, saw Bitcoin repeatedly test and ultimately break through the $20,000 level, which had been the previous all-time high and a psychological resistance point for years. Similar dynamics played out in earlier cycles around the $1,000 and $10,000 levels. The lesson from these historical parallels is patience. Bitcoin’s resistance levels rarely break cleanly on the first attempt, but they do tend to eventually succumb to the persistent pressure of growing demand and tightening supply.
Conclusion
Bitcoin’s approach to its two-year make-or-break resistance is one of the most important developments in the cryptocurrency market right now. Whether you are a seasoned trader, a long-term holder, or simply a curious observer, this is a moment that deserves close attention. The technical signals, on-chain data, and macro environment all paint a nuanced picture — one where both a bullish breakout and a bearish rejection remain genuinely possible outcomes.
What is clear is that Bitcoin has rarely faced this level with so many tailwinds at its back: institutional inflows via spot ETFs, declining exchange reserves, expanding global liquidity, and growing mainstream awareness. The coming weeks and months will reveal whether these forces are sufficient to overcome one of the most formidable resistance levels in BTC’s history.
Stay informed and stay ahead of the market. Subscribe to our newsletter, bookmark this page, and follow our ongoing Bitcoin price analysis and crypto market outlook updates to track how this critical make-or-break resistance test unfolds in real time. Knowledge is your most valuable asset in the volatile world of cryptocurrency — use it wisely.
See more;Bitcoin’s Genesis Block Turns 17: The Reality Anchor We Need