Bitcoin Price News: Capitulation Hints At Big BTC Buy Zone
Bitcoin price news points to capitulation, on-chain data and sentiment hint at a major BTC buy zone for long-term investors.
The latest Bitcoin price news has traders on edge. After ripping to a record high near 126,000 dollars in early October, BTC has crashed into the 80,000–90,000 dollar zone, wiping out over 30 percent from the peak in a matter of weeks. Many of the so-called “top buyers” who rushed in near the highs are now capitulating, dumping BTC at a loss as fear and frustration take over. At the same time, long-term on-chain metrics are flashing classic Bitcoin capitulation signals that in previous cycles have often appeared close to major bottoms rather than the start of a long bear market.
Right now, Bitcoin trades around 89,700 dollars, down sharply from its 2025 peak and struggling to reclaim the psychologically important 90,000–93,000 dollar band. Risk sentiment is shaky, leveraged traders have been flushed out, and mainstream headlines focus on “crypto wipeouts” and “crashes” instead of euphoria.
Yet beneath the panic, on-chain data shows something important: short-term holders and late-cycle buyers are realizing heavy losses, while deeper-pocketed players and long-term holders quietly accumulate. That pattern lies at the heart of why capitulation is often seen as a contrarian buy signal in Bitcoin price news.
In this article, we will unpack what capitulation really means, how on-chain metrics such as SOPR help identify when BTC is being sold at a loss, and why big realized losses from “top buyers” may indicate opportunity rather than doom. We will also explore possible price scenarios for the coming weeks and what traders should keep in mind before trying to buy the dip.
What Does It Mean When Top Buyers Sell BTC at a Loss?
When headlines mention “top buyers capitulating,” they are talking about investors who bought at or near the local top finally giving up and selling at lower prices. These are often traders who chased momentum, entered after a big run-up, or added heavy leverage when BTC looked unstoppable.
When price reverses hard, this group is under pressure. Many of them have tight risk limits, borrowed funds or emotional anchors near their entry price. As the market keeps sliding, they start to close positions just to stop the pain. That collective urge to exit creates a wave of realized losses: coins being sold below their cost basis.
For Bitcoin, this kind of capitulation is not just a story told by trading platforms. It leaves fingerprints in the blockchain itself. That is where on-chain metrics like SOPR, realized profit and loss, and short-term holder stress come in.
SOPR and Realized Losses: The On-Chain Story
To really grasp what capitulation looks like on-chain, you need to understand SOPR, or Spent Output Profit Ratio. SOPR compares the value of coins when they are spent to their value when they were created (essentially when they were last moved or purchased).
Recent Bitcoin price news has highlighted that short-term holder SOPR slid to around 0.94 as BTC traded in the 80,000–90,000 dollar band. That number may sound abstract, but it shows that the average coin moved by recent buyers was realizing a loss of about 6 percent at the time. In other words, short-term players were not just holding through the dip; they were actively accepting losses to exit.
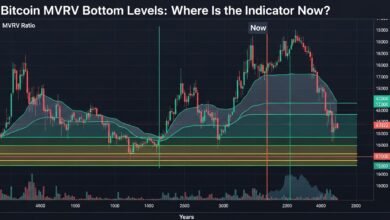
Historically, sustained periods when SOPR stays below 1, especially after euphoric rallies, often line up with capitulation lows or consolidation zones that precede strong recoveries. They signal that weak hands are giving way to stronger, more patient holders who are willing to accumulate BTC at discounted prices. This is why traders closely watch SOPR charts when they are looking for buy the dip opportunities during a Bitcoin crash.
Signs That Bitcoin Holders Are Capitulating
Short-term holders have been at the center of this storm. Data indicates that wallets that accumulated BTC near the highs are now under severe pressure, with many forced to sell to cover leverage or to avoid deeper drawdowns. Meanwhile, long-term holders, who entered at far lower prices and typically have a multi-year horizon, remain relatively stable, showing far less panic in their behavior.
Short-Term Holders vs Long-Term Whales
The tension between short-term speculators and long-term whales is one of the most important dynamics in any Bitcoin price news cycle. Short-term holders are typically more sensitive to daily volatility. They bought more recently, often at higher prices, and their conviction is usually weaker. When the market turns against them, their time horizon collapses.
Whales and long-term holders, on the other hand, often treat sharp drawdowns as noise within a broader secular uptrend. On-chain wallet data and institutional reports show that while retail and short-term traders were panic-selling in the 80,000–86,000 dollar region, larger entities and funds were quietly accumulating Bitcoin near perceived value zones around 80,000 dollars.
That does not guarantee an immediate V-shaped recovery. However, when coins move from weaker hands who buy high and sell low into stronger hands that buy low and hold for years, it tends to reduce future selling pressure and strengthen the underlying Bitcoin market structure.
Historical Drawdowns in Bull Markets
Looking back at past cycles, Bitcoin has repeatedly delivered deep but temporary drawdowns while still maintaining a long-term uptrend. In previous bull markets, BTC saw corrections of 25 to 40 percent that, in hindsight, turned out to be spectacular buying opportunities for patient investors.
What often distinguishes those bull-market corrections from early bear markets is the underlying trend in adoption and on-chain activity.
Risk Management Still Matters
Calling capitulation a potential buy the dip moment does not mean every trader should rush in with maximum leverage. Bitcoin remains a highly volatile asset, and history also shows that markets can overshoot to the downside before eventually recovering.
Prudent traders treat capitulation as a signal, not a guarantee. They might scale in gradually rather than all at once, size positions relative to their risk tolerance, and keep cash on the sidelines in case of further downside. They also accept that timing the exact bottom is extremely difficult, even with sophisticated on-chain tools.
The bottom line is that capitulation phases often tilt the risk-reward profile in favor of long-term bulls, but only for those who manage risk carefully and avoid the very over-leverage that helped create the crash in the first place.
Scenarios for BTC Price in the Coming Weeks
While no one can predict the future path of Bitcoin price news, several plausible scenarios emerge from the current data.
In a constructive scenario, the recent BTC capitulation proves to be the climax of the sell-off. SOPR and realized loss metrics normalize, volatility cools down, and BTC grinds higher, eventually reclaiming 100,000 dollars and beyond over the next several months as new capital returns and confidence rebuilds.
Which scenario plays out will depend on a mix of macro conditions, regulatory news, ETF flows and investor psychology. What is clear is that the current phase is a pivotal inflection point in the 2025 Bitcoin cycle.
Should You Buy Bitcoin After Capitulation? Key Things to Consider
With the Bitcoin price news full of capitulation headlines and BTC sold at a loss, it is natural to wonder whether now is the right time to buy. There is no universal answer, but there are several important questions any investor should ask.
The first is time horizon. Capitulation zones tend to be excellent opportunities for long-term investors who can hold through volatility, but they are far less friendly to short-term traders looking for instant gratification.
The second is risk tolerance. Bitcoin remains a high-beta asset class. Even after a heavy correction, it can still easily swing 10 percent or more in a single day. Any capital you deploy into BTC should be money you can afford to leave alone through those swings, not funds needed for short-term obligations.
The third is strategy. Dollar-cost averaging into perceived value zones, sizing positions modestly, and avoiding high leverage are ways to take advantage of BTC capitulation without exposing yourself to catastrophic risk. Chasing every bounce with aggressive margin, by contrast, is exactly how many “top buyers” ended up selling at a loss this cycle.
Finally, remember that no on-chain metric or historical pattern is perfect. SOPR, realized losses and capitulation indicators are tools, not crystal balls. They improve your odds by providing context, but they cannot remove uncertainty.
Conclusion
Bitcoin’s late-2025 crash has been severe, dramatic and emotionally draining for many traders. From a record high near 126,000 dollars to brutal spikes of realized losses and short-term holder capitulation, the market has reminded everyone that BTC’s volatility cuts both ways.
Yet the same factors that make the downturn so painful also lay the groundwork for future opportunity. On-chain data shows that top buyers and short-term holders have been selling at a loss, SOPR has dipped below 1, and one-day realized losses have reached extreme levels, all classic signs of Bitcoin capitulation. At the same time, historical research suggests that the magnitude of this drawdown is consistent with previous bull-market corrections, and that long-term players continue to accumulate near key support levels.
For patient investors, this combination of forced selling, negative sentiment and structural accumulation has often marked powerful entry zones in past cycles.
FAQs
Q: What does it mean that “top buyers” are capitulating in Bitcoin?
When top buyers capitulate, it means investors who bought near recent highs are giving up and selling their BTC at lower prices, locking in losses.
Q: Why is selling BTC at a loss sometimes seen as a buy signal?
Large waves of loss-realization often occur near exhaustion points in a downtrend, when weaker hands are flushed out and stronger hands step in to accumulate.
Q: What is SOPR and how does it help in Bitcoin analysis?
SOPR, or Spent Output Profit Ratio, measures whether the average BTC being moved on-chain is in profit or loss by comparing the price at which coins were acquired to the price at which they are spent.
Q: How big is the current Bitcoin drawdown compared to past cycles?
The current drawdown of about 30 percent from the recent all-time high near 126,000 dollars is large but broadly in line with typical bull-market corrections.
Q: Is now a good time to buy Bitcoin after this capitulation?
Whether this is a good time to buy depends on your personal risk tolerance, time horizon and strategy. On-chain data and Bitcoin price news indicate that capitulation is underway, which historically has often created attractive long-term entry points. However, prices can still fall further, and volatility remains high.