
Bitcoin Price Prediction: $50B Volume Drop Signals BTC Crisis
Bitcoin price prediction reveals alarming trends as $50B volume drops 40% while BTC tests $83K support. Expert analysis of potential breakdown ahead.
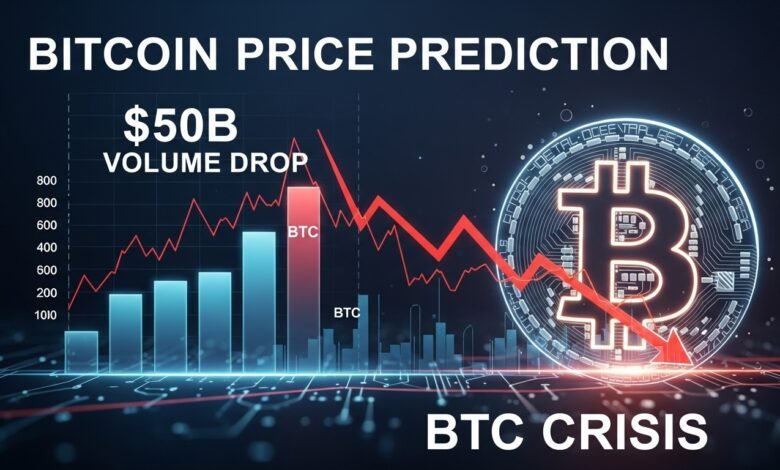
Bitcoin price prediction models are being stress-tested against unprecedented market dynamics. Recent data reveals a staggering 40% decline in trading volume, with approximately $50 billion evaporating from the market as Bitcoin struggles to maintain support above the critical $83,000 threshold. This dramatic volume contraction has sent shockwaves through the crypto community, raising urgent questions about whether a significant breakdown is imminent. As institutional investors reassess their positions and retail traders watch nervously from the sidelines, understanding the technical indicators, market sentiment, and historical patterns becomes crucial for anyone holding or considering positions in the world’s leading cryptocurrency. The convergence of declining volume and price consolidation near key support levels creates a perfect storm scenario that demands careful analysis and strategic positioning.
Current Bitcoin Market Dynamics
The cryptocurrency landscape has shifted dramatically over the past several weeks, with Bitcoin price prediction metrics showing increasingly bearish signals. The $50 billion volume reduction represents one of the most significant liquidity contractions witnessed in recent market cycles, suggesting that both buyers and sellers are adopting wait-and-see approaches rather than committing capital aggressively.
Trading volume serves as the lifeblood of any financial market, and when it contracts this severely, it typically indicates one of two scenarios: either market participants are losing interest, or they’re positioning themselves ahead of a major directional move. Historical analysis of previous Bitcoin price cycles demonstrates that substantial volume drops often precede significant volatility events, making the current situation particularly noteworthy for traders and investors alike.
The $83,000 price level has emerged as a critical battleground between bulls and bears. This psychological and technical threshold represents more than just a round number; it coincides with multiple support structures including the 200-day moving average, previous resistance-turned-support zones from earlier in the year, and key Fibonacci retracement levels that technical analysts monitor closely.
Technical Analysis: Breaking Down the $83K Support Level
From a technical perspective, the Bitcoin price prediction landscape becomes clearer when examining multiple timeframes and indicators simultaneously. The daily chart reveals a concerning pattern of lower highs since Bitcoin peaked earlier this year, while the weekly timeframe shows a potential head-and-shoulders formation that could signal further downside if the neckline breaks.
The Relative Strength Index currently hovers in neutral territory around the 45-50 range, neither confirming strong bullish momentum nor indicating oversold conditions that might attract bargain hunters. This middling reading combined with declining volume creates what technical analysts call a “compression phase” where the market is coiling energy for the next significant move.
Moving Average Convergence Divergence indicators are showing bearish divergence on multiple timeframes, suggesting that while price has maintained relatively stable levels, the underlying momentum continues to weaken. This divergence between price action and momentum indicators historically precedes directional breakouts, though it cannot predict which direction with certainty.
The volume profile analysis reveals that the $83,000 level sits at the lower boundary of a high-volume node, meaning significant trading occurred at these prices previously. When price returns to high-volume areas, they typically act as support or resistance depending on market sentiment. The current test of this zone will determine whether accumulated buyers at these levels will defend their positions or capitulate, potentially triggering a cascade of stop-loss orders.
Volume Analysis: Why the 40% Drop Matters for Bitcoin Price Prediction
Volume analysis forms a cornerstone of accurate Bitcoin price prediction methodology because it reveals the conviction behind price movements. A 40% reduction in trading volume while price consolidates near critical support suggests several troubling scenarios for the cryptocurrency market.
Firstly, declining volume during consolidation periods often indicates exhaustion of the prevailing trend. If Bitcoin was in a healthy uptrend, we would expect volume to expand on rallies and contract on pullbacks. Instead, we’re observing the opposite pattern, with volume drying up across both upward and downward price movements, suggesting indecision and lack of conviction from market participants.
The $50 billion volume evaporation also reflects reduced participation from institutional investors, who typically contribute substantial liquidity to the market. Recent regulatory developments, macroeconomic uncertainties, and profit-taking after previous rallies have caused many large players to reduce their active trading, creating thinner order books that are more susceptible to volatile price swings.
Furthermore, declining volume in spot markets combined with elevated activity in derivatives markets suggests that sophisticated traders are hedging their positions rather than taking directional bets. This defensive positioning indicates that even professional market participants are uncertain about near-term Bitcoin price direction, preferring to manage risk through options and futures rather than committing capital to spot purchases.
On-Chain Metrics Revealing Critical Bitcoin Price Prediction Insights
Beyond traditional technical analysis, on-chain metrics provide unique insights into Bitcoin price prediction scenarios by examining blockchain data directly. These metrics offer a transparent view into investor behavior that isn’t available in traditional financial markets.
The number of active addresses interacting with the Bitcoin network has declined substantially, mirroring the volume reduction and suggesting decreased retail participation. When fewer unique addresses are transacting, it indicates that the user base is contracting or that existing users are reducing their activity levels, both of which represent headwinds for price appreciation.
Exchange inflow and outflow data reveals a concerning trend where more Bitcoin is flowing onto exchanges rather than into cold storage. Historically, when investors move cryptocurrency onto exchanges, it signals preparation to sell, whereas withdrawals to cold storage indicate long-term holding intentions. The current pattern suggests that holders may be positioning to exit positions if support levels fail.
The spent output profit ratio, which measures whether Bitcoin being transacted is in profit or loss, has been declining steadily. This indicates that many recent buyers are underwater on their positions, creating potential selling pressure if these investors capitulate. The psychology of loss aversion suggests that when underwater investors see additional downside, they may panic sell to prevent further losses, creating cascading effects.
Market Sentiment and Fear Index Impact on Bitcoin Price
Market sentiment plays a crucial role in Bitcoin price prediction models, as cryptocurrency markets are particularly susceptible to emotional trading compared to traditional assets. The current Fear and Greed Index has shifted decidedly toward fear territory, reflecting the anxiety permeating the market as volume contracts and price consolidates near critical support.
Social media sentiment analysis across platforms including Twitter, Reddit, and specialized cryptocurrency forums shows increasingly bearish undertones. While sentiment indicators shouldn’t be used in isolation, they provide valuable context about the psychological state of retail investors who often represent the marginal buyers and sellers that move markets at critical junctures.
The funding rates in perpetual futures markets have turned negative, meaning that short sellers are paying long position holders to maintain their bets against Bitcoin. While contrarian investors sometimes view extreme negative funding as a bullish signal suggesting over-positioning by bears, the current moderately negative rates simply indicate a general bearish bias without reaching capitulation levels that might spark a reversal.
Google Trends data for searches related to “Bitcoin price prediction” and related terms has declined from peak levels, suggesting reduced mainstream interest in cryptocurrency. While this might create opportunities for contrarian investors, it also indicates that the new capital inflows that drive bull markets are currently absent from the ecosystem.
Macroeconomic Factors Influencing Bitcoin Price Prediction Models
The broader macroeconomic environment significantly impacts Bitcoin price trajectories, as cryptocurrency markets have increasingly correlated with traditional risk assets. Current economic conditions present a challenging backdrop for speculative investments including Bitcoin.
Central bank policies globally remain in restrictive territory with elevated interest rates designed to combat persistent inflation. Higher interest rates increase the opportunity cost of holding non-yielding assets like Bitcoin, as investors can earn substantial returns from relatively safe government bonds and money market funds. This dynamic has drawn capital away from cryptocurrency markets toward traditional fixed-income instruments.
The US dollar strength has also created headwinds for Bitcoin, as the cryptocurrency typically exhibits an inverse correlation with the dollar index. A strong dollar makes Bitcoin more expensive for international buyers and signals risk-off sentiment in global markets, both of which pressure cryptocurrency valuations.
Geopolitical uncertainties including ongoing conflicts, trade tensions, and political instabilities traditionally benefited Bitcoin as a potential safe-haven asset. However, during the current crisis periods, investors have favored traditional safe havens like gold and government bonds over cryptocurrency, suggesting that Bitcoin hasn’t yet achieved the safe-haven status that many proponents envisioned.
Historical Patterns: What Previous Volume Drops Tell Us About Bitcoin Price
Examining historical precedents provides valuable context for current Bitcoin price prediction scenarios. Previous instances where Bitcoin experienced similar volume contractions while testing major support levels offer instructive case studies about potential outcomes.
During the 2018 bear market, Bitcoin exhibited several periods of declining volume as it established lower support levels throughout the year. Each time volume contracted significantly while price consolidated, the eventual breakdown led to accelerated selling as support failed and stop-losses triggered. The pattern repeated multiple times until Bitcoin reached its cycle bottom around $3,200.
Conversely, the 2020 consolidation period before Bitcoin’s historic rally to all-time highs also featured declining volume phases. However, the critical difference was that Bitcoin maintained support levels during these periods and eventually broke upward when volume returned to the market. This demonstrates that volume contraction alone doesn’t determine direction; the price action during low-volume periods and the eventual return of volume provide the decisive signals.
The 2021 summer consolidation saw similar dynamics with contracting volume as Bitcoin traded in a range between $30,000 and $40,000 for several months. When volume eventually returned, Bitcoin broke upward initially before eventually succumbing to broader market pressures later in the year. This example illustrates that even successful defenses of support during low-volume periods don’t guarantee sustained rallies without fundamental catalysts.
Potential Breakdown Scenarios and Price Targets for Bitcoin
If the current support at $83,000 fails, Bitcoin price prediction models suggest several potential downside targets based on technical analysis and historical support levels. Understanding these scenarios helps investors prepare appropriate risk management strategies.
The first major support zone below current levels sits around $75,000-$77,000, representing the previous consolidation range from earlier market action. This level also coincides with the 0.618 Fibonacci retracement of the recent rally, making it a logical profit-taking and potential reversal zone. A breakdown to this level would represent approximately a 7-10% decline from current prices.
If the $75,000 support fails to hold, the next critical level emerges around $68,000-$70,000, where the 200-week moving average currently resides. This long-term moving average has historically provided strong support during corrections in bull markets, making it a level where long-term investors might defend their positions aggressively. A decline to this range would represent a roughly 15-18% drop from current levels.
The worst-case scenario within the current market structure would see Bitcoin testing the $60,000 psychological level, which represents the previous cycle high from 2021. Many investors consider this level as the ultimate line in the sand for the current bull market structure. A breakdown below $60,000 would likely trigger significant stop-loss orders and potentially initiate a deeper correction toward $50,000 or lower.
Alternative Bullish Scenario: Defending the $83K Level
While the current setup appears precarious, several scenarios exist where Bitcoin price could defend current support levels and potentially rally. Understanding bullish alternatives provides balanced perspective for investment decisions.
Volume cycles in cryptocurrency markets often bottom before price, meaning the current volume reduction might represent capitulation selling rather than the beginning of further decline. If buyers step in to defend $83,000 decisively with increasing volume, it would signal that accumulation is occurring at these levels and could mark a local bottom.
The recent volume contraction might also reflect reduced selling pressure rather than reduced buying interest. If holders are simply choosing not to sell at current prices while waiting for higher levels, the lack of supply could eventually create a squeeze higher when any buying pressure returns to the market. This scenario would manifest as a sharp volume expansion accompanying an upward price break.
Institutional accumulation patterns sometimes occur during low-volume periods when large players can acquire positions without moving price significantly. If entities like MicroStrategy, institutional asset managers, or sovereign wealth funds are quietly accumulating during this consolidation, the eventual revelation of these positions could catalyze a rally once the market recognizes the reduced available supply.
Trading Strategy Considerations for Current Bitcoin Price Levels
Given the uncertain Bitcoin price prediction outlook, developing appropriate trading strategies becomes crucial for managing risk while maintaining upside exposure. Different investor profiles require distinct approaches based on time horizons and risk tolerance.
Conservative investors might consider reducing position sizes during this period of uncertainty, moving to cash or stablecoins to preserve capital until clearer directional signals emerge. This approach sacrifices potential upside if Bitcoin rallies but protects against the downside risk that appears elevated given current technical conditions. Waiting for either a clear breakdown below $83,000 or a decisive reclaim of higher resistance levels provides more favorable risk-reward entry points.
Aggressive traders might employ range-trading strategies, buying near the $83,000 support with tight stop-losses below and taking profits near resistance around $88,000-$90,000. This approach capitalizes on the consolidation pattern while maintaining strict risk controls. The key to success with this strategy involves disciplined execution of stops if support fails to prevent small losses from becoming large ones.
Long-term investors with multi-year horizons might view current levels as accumulation opportunities, implementing dollar-cost averaging strategies that spread purchases across time to mitigate timing risk. This approach assumes eventual appreciation over longer timeframes regardless of near-term volatility. Setting predetermined purchase amounts at various lower price levels provides a systematic approach to building positions during uncertainty.
Impact of Regulatory Developments on Bitcoin Price Prediction
Regulatory clarity and government policies significantly influence Bitcoin price trajectories, as institutional adoption requires clear legal frameworks. Recent regulatory developments present both opportunities and challenges for cryptocurrency markets.
The ongoing discussions around cryptocurrency regulation in major economies including the United States, European Union, and Asia create uncertainty that suppresses institutional investment. Many potential corporate and institutional buyers remain on the sidelines awaiting clearer regulatory guidance before committing substantial capital to Bitcoin. This regulatory overhang contributes to the volume reduction as participants adopt wait-and-see approaches.
Conversely, any positive regulatory developments such as approval of additional Bitcoin exchange-traded funds, clearer taxation frameworks, or favorable legislation could catalyze rapid inflows into cryptocurrency markets. The asymmetric nature of regulatory news means that positive developments could spark rallies while negative news often gets absorbed more gradually as markets anticipate and price in potential restrictions.
The increasing global interest in central bank digital currencies simultaneously validates blockchain technology while potentially competing with Bitcoin for adoption. How these dynamics evolve will significantly impact long-term Bitcoin price prediction models, as the relationship between government-backed digital currencies and decentralized cryptocurrencies remains uncertain.
Mining Economics and Hash Rate Implications for Bitcoin
The Bitcoin mining sector provides important signals for Bitcoin price prediction analysis, as miner behavior and economics often foreshadow price movements. Current mining dynamics present a mixed picture for future price action.
The network hash rate remains near all-time highs despite recent price consolidation, indicating that miners remain committed to securing the network even at current price levels. High hash rate generally represents a healthy network with robust security, but it also means mining difficulty remains elevated, increasing production costs per Bitcoin.
Miner profitability has compressed significantly as electricity costs remain elevated globally while Bitcoin prices have not kept pace with previous highs. When mining becomes marginally profitable or unprofitable for less efficient operators, these miners may be forced to sell their Bitcoin holdings to cover operational expenses, creating selling pressure on the market. Monitoring miner outflows to exchanges provides early warning signals of this capitulation.
The upcoming Bitcoin halving cycle, which reduces miner rewards by half approximately every four years, remains a significant consideration for long-term Bitcoin price trajectories. Historical patterns show that Bitcoin typically experiences substantial rallies following halvings as the reduced supply inflation impacts market dynamics. However, the lag between halving events and price appreciation can span several months, requiring patience from investors anticipating this catalyst.
Correlation Analysis with Traditional Markets and Risk Assets
Understanding Bitcoin’s correlation with traditional financial markets enhances Bitcoin price prediction accuracy, as cryptocurrency increasingly trades as a risk-on asset rather than an independent store of value. Current correlation patterns provide context for potential price movements.
Bitcoin’s correlation with technology stocks and the Nasdaq index has increased substantially in recent years, suggesting that cryptocurrency now responds to similar macroeconomic drivers as growth stocks. This correlation means that Bitcoin could face additional pressure if equity markets experience corrections driven by economic slowdowns or tightening financial conditions.
The correlation with gold, traditionally viewed as an alternative safe-haven asset, remains relatively low, indicating that investors still view Bitcoin and gold as serving different portfolio functions. When Bitcoin correlation with gold increases, it might signal growing acceptance as a store of value, but current data suggests this evolution remains incomplete.
The US dollar index shows a strong inverse correlation with Bitcoin, as previously mentioned. If the dollar weakens due to Federal Reserve policy shifts or global reserve currency diversification, it could provide significant tailwinds for Bitcoin price appreciation. Conversely, continued dollar strength in response to interest rate differentials would likely pressure cryptocurrency valuations.
Expert Predictions and Analyst Consensus on Bitcoin Price
Gathering perspectives from respected cryptocurrency analysts and institutions provides additional context for Bitcoin price prediction scenarios, though investors should recognize that expert opinions vary widely and should not be followed blindly.
Several prominent analysts maintain bullish long-term outlooks for Bitcoin despite near-term uncertainties, citing factors including increasing institutional adoption, improving regulatory clarity, and Bitcoin’s finite supply in an environment of expanding fiat currency supplies. These bulls typically target prices ranging from $150,000 to $500,000 over multi-year timeframes, though they acknowledge that significant volatility will occur along the way.
More conservative analysts express caution about near-term prospects, pointing to the declining volume, weakening technical indicators, and challenging macroeconomic backdrop as reasons to expect consolidation or correction before any sustainable rally. These bears often suggest that Bitcoin could revisit the $60,000-$70,000 range before establishing a durable bottom for the next leg higher.
Institutional research from major financial firms increasingly covers Bitcoin, with most maintaining neutral-to-cautious ratings given current valuations and market conditions. These institutions typically recommend that cryptocurrency represent only small allocations within diversified portfolios, reflecting both the potential upside and significant volatility inherent in the asset class.
Conclusion
The cryptocurrency market stands at a pivotal moment as the 40% decline in trading volume and Bitcoin’s test of the critical $83,000 support level create a decision point that will likely determine near-term price direction. The Bitcoin price prediction landscape reveals significant risks alongside potential opportunities for disciplined investors who approach the market with clear strategies and appropriate risk management.
The technical picture presents challenges with declining volume, bearish divergences, and price consolidating near major support. However, history demonstrates that similar setups have resolved both upward and downward, making the current situation one requiring vigilance rather than panic. The eventual return of volume will provide the decisive signal about whether buyers or sellers control the next major move.
For investors and traders seeking to navigate these uncertain waters, maintaining flexibility becomes paramount. Those who blindly hold positions through major support breakdowns risk substantial losses, while those who sell prematurely might miss significant rallies if support holds and volume returns with bullish momentum. The key lies in identifying personal risk tolerance, establishing clear rules for position management, and following those rules with discipline.
Whether you’re actively trading Bitcoin price movements or holding for long-term appreciation, staying informed about volume trends, technical developments, and broader market conditions will help you make educated decisions during this critical period. The coming weeks will likely provide clarity about whether the $50 billion volume drop represents capitulation and a final flush before recovery, or the early stages of a more significant correction that tests lower support levels.
See more;Bitcoin Price ATH Q1 2025: Bitwise CEO Prediction Analysis