How Long Until Bitcoin Recovers? Data Reveals Key Clues
Wondering how long until Bitcoin recovers? Historical data, on-chain metrics, and cycle patterns reveal the most likely BTC recovery timeline.
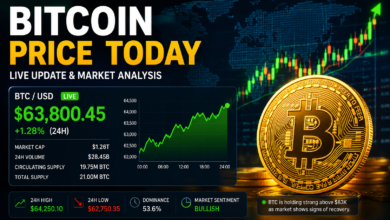
If you have been watching the crypto market lately, one question dominates every conversation: how long until Bitcoin recovers? As of February 2026, Bitcoin is trading near $67,700 — down roughly 47–50% from its October 2025 all-time high of $124,700. For some investors, that number stings. For others who have followed Bitcoin through multiple cycles, it looks remarkably familiar. The asset has been in this exact correction range before, and history offers a surprisingly consistent answer about what tends to happen next. This article breaks down the Bitcoin recovery timeline using real on-chain data, historical price cycles, and current market conditions to help you understand what the data actually says — and what it does not.
How Long Until Bitcoin Recovers? What the Historical Data Shows
Data is the most honest voice in a room full of speculation. When analysts examine every major Bitcoin price recovery since 2014, a clear pattern emerges. In every instance where Bitcoin dropped between 40% and 50% from a cycle peak — and there have been roughly nine confirmed events fitting that definition — the asset has recovered to a new all-time high every single time.
The average recovery time from trough to a prior high within this correction range runs approximately 9 to 14 months. Full bear markets, by comparison, have historically taken 24 to 36 months or longer to recover. That is a meaningful distinction. The current drawdown is not behaving like the catastrophic 80%+ collapses seen in 2013–2015 or 2017–2018. It is behaving like a mid-cycle correction — painful, yes, but historically a reset within an ongoing bull market rather than its end.
The average multiple from the correction trough to the next cycle high sits at approximately 3.4 times, with the range running from roughly 1.8 times on the lower end to 5.6 times at the top. Those figures do not guarantee anything, but they frame the risk-reward in a way that raw price charts alone cannot.
Understanding the Bitcoin Bear Market Duration by Cycle
One of the most useful frameworks for estimating a Bitcoin bear market duration is looking at how these cycles have evolved over time. They have not stayed static — they have actually compressed.
Past Bitcoin bear markets show a clear trend of becoming shorter with each cycle. The first major downturn lasted about 410 days. The second cycle lasted around 365 days. The most recent completed bear market lasted roughly 330 days. This compression is not accidental. As institutional capital deepens the market, as liquidity improves, and as more sophisticated investors participate, severe dislocations correct faster. The market has more stabilizing forces than it did a decade ago.
When historical data is analyzed using trend-based models, the current bear market is projected to last closer to 288 days — shorter than any prior cycle. If that projection holds, it points toward a potential market bottom in mid-2026. However, it is important to note that projection timelines shift as new price data arrives.
What makes Bitcoin cycle analysis tricky is that no two corrections are identical. The 2021 mid-cycle correction, for example, saw Bitcoin drop 53% from its April peak before recovering to a new all-time high by November of that year. That recovery took roughly six months. If the current drawdown follows a comparable pace, the BTC price recovery could materialize within the second or third quarter of 2026.
H2: Is the Current Bitcoin Correction a Bear Market or a Reset?
This is perhaps the most critical question facing investors right now, and the data suggests a more optimistic answer than headlines imply.
Bitcoin’s current drawdown — a 31% to 47% drop from its peak — falls within the historical 25–50% range typical of bull market resets. The 31% decline from $126,000 to $87,000 sits well below the 53% May 2021 correction and far below the 80%+ bear markets of 2013–2015 and 2017–2018.
Until key support levels fail — particularly the Bitcoin $70,000 support level — analysis points toward consolidation within an ongoing bull cycle rather than the start of a multi-year bear market.
The distinction matters enormously for anyone asking when will Bitcoin go back up. A mid-cycle correction has historically resolved within three to six months after the bottom is established. A full bear market, on the other hand, can grind on for two to three years. The structural evidence — ETF inflows, institutional accumulation, on-chain data showing buyers absorbing sell pressure — currently supports the mid-cycle interpretation.
What On-Chain Metrics Reveal About Bitcoin’s Bottom
On-chain data gives investors a window into actual market behavior that price charts alone cannot capture. One widely followed indicator compares the percentage of Bitcoin supply currently held at a profit versus the percentage held at a loss. When a large portion of the supply flips into loss territory, it has historically coincided with market bottoms — not because of sentiment, but because it marks the point where forced selling tends to exhaust itself.
Bitcoin has shown early rebound behavior, trading roughly 8% above its February 5 low. Historically, these initial snapbacks tend to follow a period where forced selling exhausts itself and selling pressure drops. The pattern repeats across multiple cycles in the data.
Additionally, Bitcoin accumulation addresses — wallets that only add coins and rarely send them — have been growing steadily through the current drawdown. Long-term holders are not panicking. They are buying. That behavior has preceded every major BTC recovery in the asset’s history.
The Role of Macro Conditions in Bitcoin’s Recovery Timeline
No analysis of the Bitcoin recovery timeline would be complete without addressing the macroeconomic backdrop. Bitcoin does not exist in a vacuum. It has developed an increasingly tight relationship with broader risk-asset sentiment, monetary policy, and global liquidity conditions.
Macro clarity also matters. Continued dovish signals from the Federal Reserve — rate cuts or pauses in tightening — easing inflation data, and calmer equity markets reduce pressure on risk assets. When stocks stabilize, Bitcoin typically follows. A weakening dollar further supports Bitcoin demand.
The Federal Reserve’s rate cycle is a significant variable here. As inflation has continued to moderate, markets are pricing in potential rate reductions in 2026. Historically, periods of monetary easing have been highly favorable for Bitcoin price recovery, as lower rates push capital out of safe-haven assets and into higher-risk, higher-reward investments.
Institutional behavior adds another layer. Bitcoin ETF inflows have remained a consistent demand driver since the landmark January 2024 approvals. Even during the current correction, ETF outflows have been measured rather than panicked — suggesting that institutional holders view the drawdown as an opportunity, not a crisis.
How Bitcoin Halvings Influence Recovery Timing
The Bitcoin halving is one of the most discussed events in cryptocurrency analysis, and for good reason. Every four years, the number of new Bitcoin issued per block is cut in half, reducing the rate of supply growth. Historically, this supply shock has preceded major bull runs by roughly six to twelve months.
The most recent halving occurred in April 2024. Bitcoin’s price reached new all-time highs, topping $73,000 by March 2024 after the SEC approved Bitcoin exchange-traded funds, and then reached $100,000 by December following the re-election of Donald Trump. The halving’s supply shock combined with surging institutional demand created one of the most powerful rallies in the asset’s history — eventually pushing Bitcoin past $124,000 by October 2025.
Post-halving cycles have historically delivered their peak gains within 12 to 18 months of the halving date. If that timeline holds, the current drawdown could represent the mid-cycle consolidation phase, with the final blow-off phase still ahead in late 2026 or into 2027.
Bitcoin Price Recovery: What Different Scenarios Look Like
Rather than offering a single prediction, sophisticated analysts model multiple scenarios. Understanding those scenarios gives investors a clearer sense of what they are actually navigating.
In the bullish case, Bitcoin finds its footing near the $65,000–$70,000 support zone, macro conditions stabilize, institutional buyers continue accumulating, and the asset begins a steady recovery leg toward and eventually beyond its previous all-time high. Most analysts expect Bitcoin to be worth between $125,000 and $200,000 in a bullish scenario for 2026, driven by ETF inflows, institutional adoption, and a bullish market structure.
In the neutral or consolidation case, Bitcoin trades sideways within a broad range for an extended period — similar to how it behaved between May and October 2021 — before eventually resolving higher. This scenario tests investor patience but does not damage the long-term thesis.
In the bearish case, key support levels near $70,000 fail, macro conditions deteriorate, and Bitcoin experiences a deeper correction toward the $55,000–$60,000 range before recovering. The most cautious credible forecasts see Bitcoin dropping to the $70,000–$75,000 range if key support fails, with an extreme stress-test low near $55,000–$57,000 in a severe macro downturn. Even in this scenario, the long-term structural bull case remains intact — it simply extends the Bitcoin bear market duration further.
Key Indicators to Watch for Signs of Bitcoin Recovery
If you want to track the BTC price recovery in real time, focus on these key indicators rather than daily price noise.
The 200-day moving average is a foundational indicator for long-term trend analysis. Historically, sustained Bitcoin recoveries only begin when price reclaims and holds above this level. It represents the dividing line between long-term bull and bear trend conditions.
Exchange netflows reveal whether Bitcoin is being withdrawn from exchanges — a bullish signal suggesting holders intend to hold rather than sell — or deposited onto exchanges, which signals potential selling pressure ahead. Sustained negative netflows during a correction have historically preceded recovery rallies.
The Realized Price metric shows the average cost basis of all Bitcoin in circulation. When Bitcoin’s market price drops to or near the Realized Price, it signals extreme undervaluation — a condition that has historically marked major Bitcoin cycle bottoms.
Funding rates in the futures market tell you about the balance of leverage. Negative funding rates mean short sellers are paying long holders, indicating excessive bearish sentiment. These conditions have historically resolved with sharp upside moves, as the market tends to squeeze the crowded side of the trade.
What Seasoned Investors Are Doing Right Now
History rewards those who can separate signal from noise during drawdowns. The investors who bought Bitcoin during the 2018 bear market below $4,000, or during the March 2020 COVID crash below $4,000, or during the 2022 bear market below $20,000, did not do so because they were certain. They did so because the data suggested asymmetric opportunity — and it delivered.
After each major crash — such as the 2014 Mt. Gox collapse or the 2022 crypto winter — Bitcoin regained losses and reached new all-time highs within 2–3 years. That track record does not eliminate risk, but it does contextualize it. The Bitcoin recovery data consistently shows that patience has been rewarded at every major cycle low.
Seasoned investors are currently focusing on dollar-cost averaging into strength, not chasing bottoms with lump sums. They are monitoring on-chain accumulation by long-term holders, watching macro indicators for signs of Fed policy pivots, and maintaining position sizes they can hold through further downside without forced selling.
Conclusion
So, how long until Bitcoin recovers? The data points toward a recovery timeline of 9 to 14 months from the cycle trough — which, if the bottom was established in early February 2026, would place meaningful recovery momentum somewhere between late 2026 and early 2027. Bear market cycles are shortening, institutional support is structurally stronger than in previous cycles, and the current drawdown falls squarely within the range that has preceded every major Bitcoin bull run in recorded history.
None of this is a guarantee. Markets can and do deviate from historical patterns. Macro shocks, regulatory surprises, or a breakdown of key support levels could extend the timeline significantly. But the weight of evidence — cycle compression, on-chain accumulation, ETF demand, halving supply dynamics, and declining maximum drawdown severity — all point in the same direction.
The most important thing you can do right now is not to predict the exact bottom, but to have a clear plan. Define your position size, understand your risk tolerance, set your accumulation levels, and let the data guide your decisions rather than fear or euphoria. If the question “how long until Bitcoin recovers” is keeping you up at night, the answer the data gives is: sooner than the headlines suggest, and probably from a price level most investors will wish they had bought.
See more: Bitcoin Price Dips 0.9% As Bulls Defend Key Support